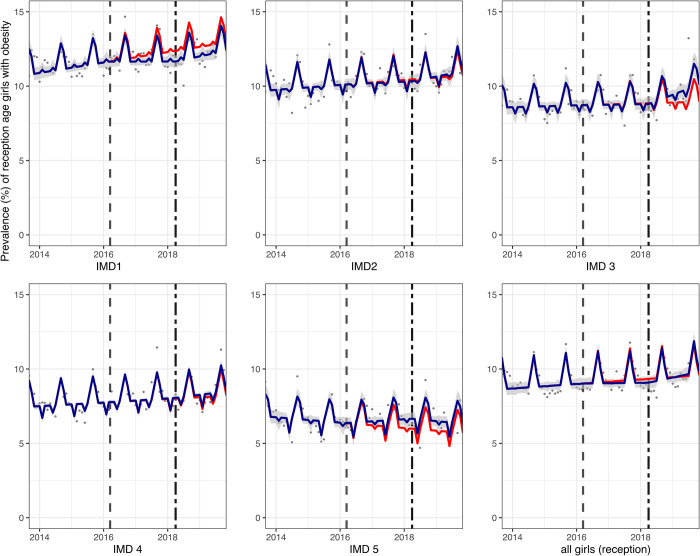
Fig 3. Prevalence (%) of obesity in girls in reception class (aged 4/5) between September 2013 and November 2019.
Observed and modelled prevalence of obesity is shown by IMD quintile and overall. Dark blue points show observed data and dark blue lines (with grey shadows) shows modelled data (and 95% CIs) of obesity prevalence. The red line indicates the counterfactual line based on the pre-SDIL announcement trends (assuming the announcement and implementation had not occurred). The first and second dashed vertical lines indicate the announcement and implementation of the SDIL, respectively. CI, confidence interval; IMD, index of multiple deprivation; SDIL, soft drinks industry levy.

