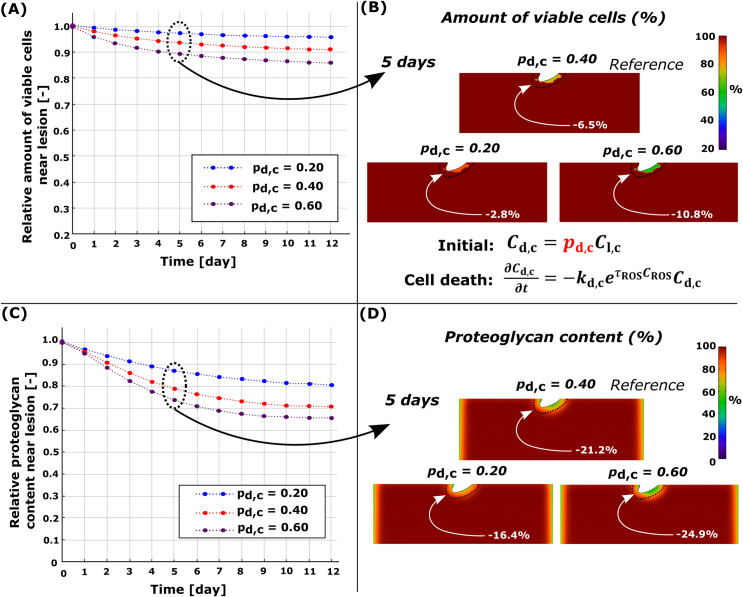
Fig 6. Sensitivity analysis for simulated damaged cell rate pd,c.
Comparison of temporal and spatial changes at day 5 (A)-(B) in cell viability and (C)-(D) in proteoglycan (PG) content. (A) Higher number of damaged cells led to more cell death and (C) more intensive PG degeneration near the cartilage lesion. Red line in (A) and (B) refers to the reference model (pd,c = 0.40).

