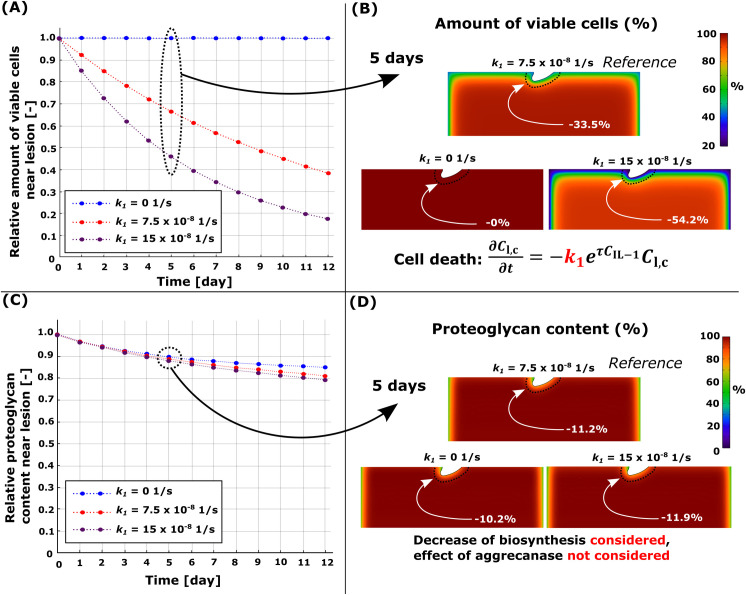
Fig 7. Sensitivity analysis for the simulated pro-inflammatory cytokine-induced apoptosis rate k1.
Comparison of temporal and spatial changes at day 5 (A)-(B) in cell viability and (C)-(D) in proteoglycan (PG) content. (A) Loss of viable cells and, thus, a decrease of PG biosynthesis (aggrecanase-induced PG degeneration was not considered), had (C) a negligible effect on the simulated PG content over 12 days. Red line in (A) and (B) refers to the reference model (k1 = ).

