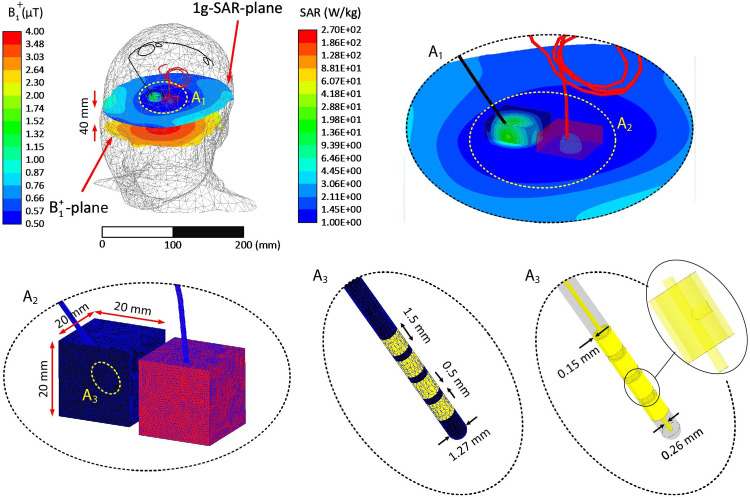
Fig 3. Example of mesh density in the lead, insulation, and SAR boxes of a representative patient (ID12) at 3 T.
A1: Closeup view of leads withing the high-resolution mesh regions. A2-A3: Schematic of mesh in the cubic area surrounding the lead tips and on the lead electrodes. A3: View of interconnections between electrodes and the central core. The coil’s input power was adjusted to generate a GHSAR of 3 W/kg. The distribution of 1g-SAR on a plane passing through the lead tips, the distribution of B1+ on an axial plane passing through the patient’s forehead, and the lead’s contacts’ geometrical details are also presented.

