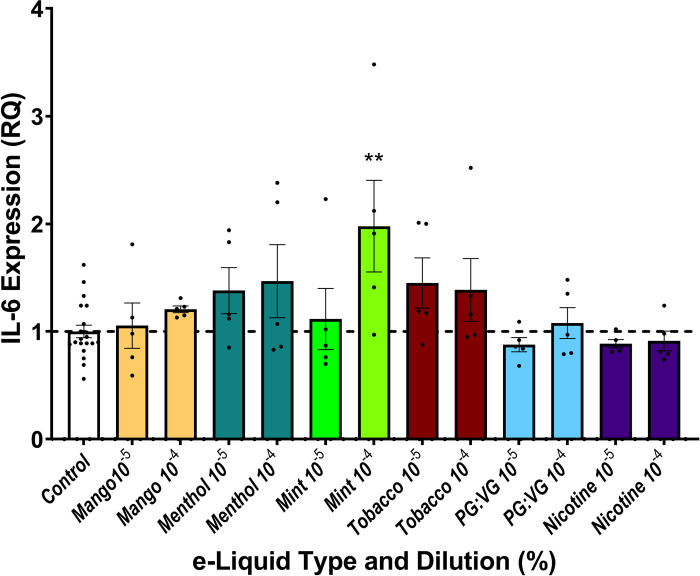
Fig 5. Inflammatory gene expression and pod e-liquid exposure.
Interleukin-6 (IL-6) expression in endothelial cells was quantified using reverse transcription-quantitative PCR, respectively. All 2-ΔΔCT values were computed relative to untreated cells, and comparisons were made between the control and tested dilutions of each e-liquid (n = 5). Data are expressed as gene expression levels normalized to matched controls. RQ = relative quantification. ** indicates p<0.01.

