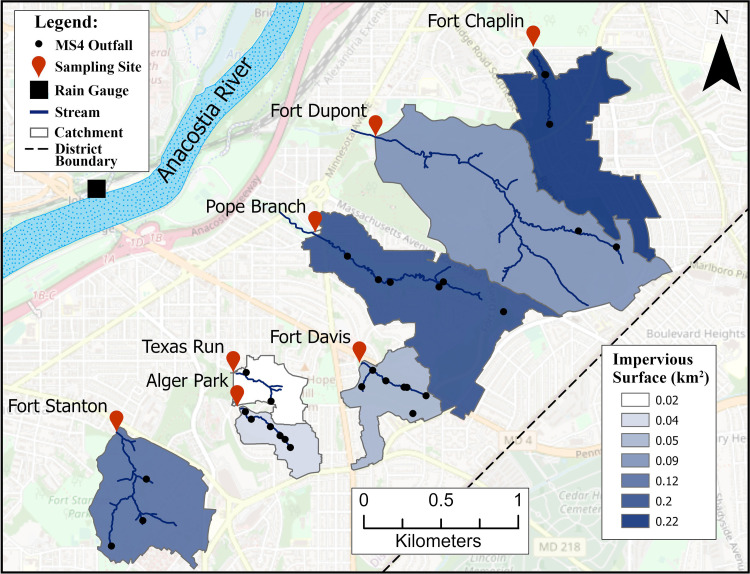
Fig 1. Geographic information system (GIS) map showing size and location of seven catchments included in study.
Sampling locations are denoted with a red symbol. The rain gauge is indicated by a black shaded square. Catchments are colored based on total impervious surface area (km2). See legend for stream and catchment boundary information. The underlaying street map is from OpenStreetMap (Data available under the Open Database License: https://www.openstreetmap.org/copyright).

