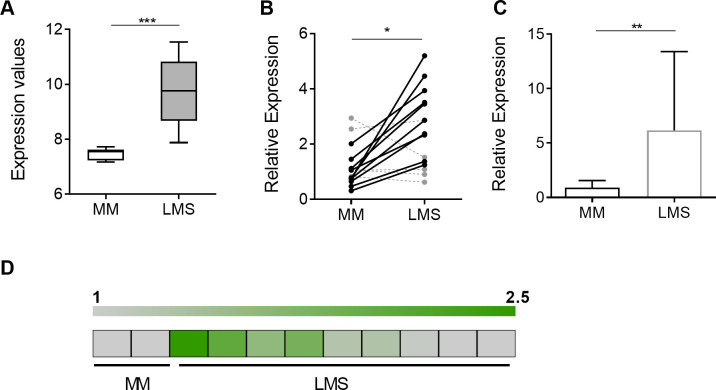
Fig 1. MiRNA-130b expression is upregulated in LMS.
(A) Relative miR-130b levels, determined by miRNA array profiling of myometrial (MM; n = 10) and leiomyosarcoma (LMS; n = 10) tissues adapted from previously published data [14]. (B) Relative miR-130b levels, measured by RT-qPCR, in separate cohort of matched MM and LMS tissues (n = 15). Expression values are normalized to the average miR-130b expression levels for the whole MM group. (C) Relative miR-130b levels, measured by RT-qPCR, in a third cohort of non-matched MM (n = 19) and LMS (n = 13) tissues. (D) Gene amplification, determined by qPCR, of the MiR-130b locus in MM (n = 2) and LMS (n = 9) tissue samples, represented as a heat map. Average levels in normal MM (= 1) are indicated by grey color; amplified loci are represented by shades of green. Statistical analyses were performed by two-tailed students t-test; *P < 0.05, ** P < 0.005, *** P < 0.001.

