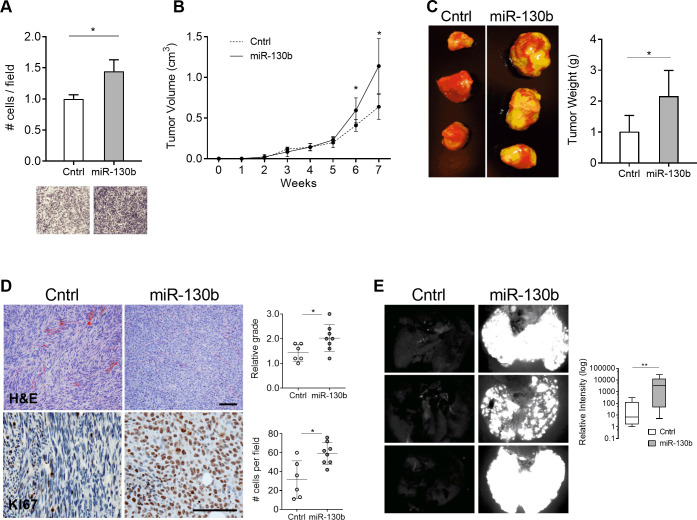
Fig 2. MiR-130b overexpression enhances LMS invasion and metastasis.
(A) Transwell assay showing relative invasion of miR-130b overexpressing LMS1 cells and control 18 h after seeding (n = 3, per group). Images show crystal violet staining of membrane inserts. Cell counts were normalized to the control group. (B) Primary tumor growth following subcutaneous injection of control (n = 6) and miR-130b (n = 8) transduced LMS1 cells in immunocompromised mice. (C) Representative images of primary tumors at the 7-weeks endpoint (left panel). Mean weight of resected primary tumors at endpoint for control (n = 6) and miR-130b (n = 8) groups (right panel). (D) H&E (top panels) and Ki67 (bottom panels) stained primary tumors removed at endpoint. Scale bar: 100 μm. Plots show histological grading of tumor architecture (1 = fascicular; 3 = storiform) (top), and number of Ki67 positive cells per field (bottom). (E) Fluorescent images of GFP positive nodules in whole lungs recovered at endpoint from control and miR-130b transduced LMS1 cells. Box plot (right) depicts quantification of GFP signal intensity in lungs of control (n = 6) and miR-130b (n = 8) groups. Statistical analyses were performed by two-tailed students t-test; *P < 0.05, ** P < 0.005.

