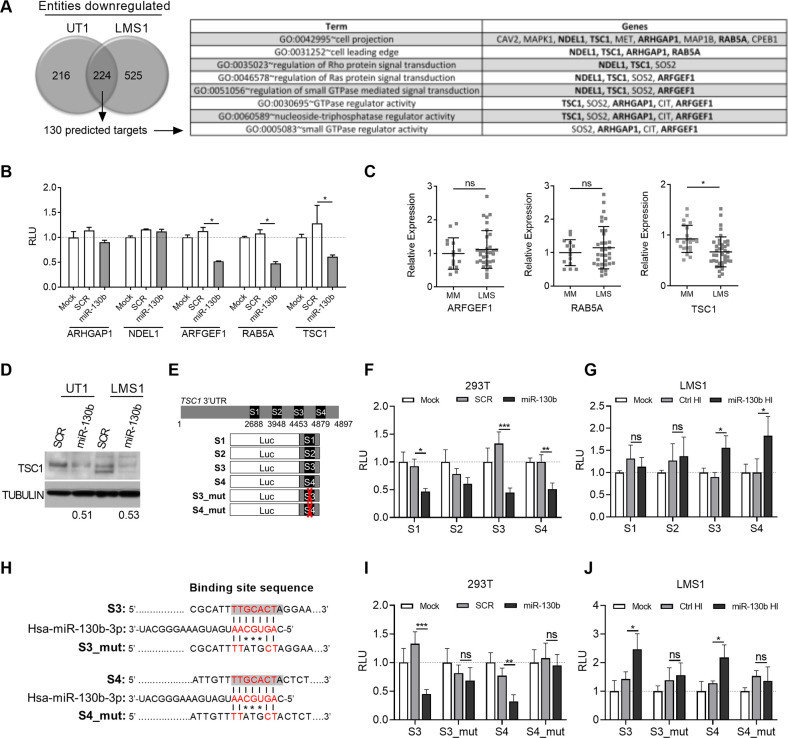
Fig 3. TSC1 is a direct target of miR-130b and downregulated in LMS.
(A) Number of transcripts showing significant downregulation (fold change: 1.33; P < 0.05) following gene array profiling of SK-LMS1 and SK-UT1 cell lines transfected with miR-130b or mimic controls (left). Profiling was performed in triplicate for each cell line. Gene ontology analysis was performed on shared downregulated genes identified as putative direct targets by target site prediction (130 total), revealing enrichment of pathways associated with cell motility and Rho GTPase signaling (right). (B) Luciferase-3’UTR reporter assay for validation of 5 candidate miR-130b targets selected from (A). Values represent relative luciferase units (RLU) in 293T cells following mock (no mimic), SCR or miR-130b mimic transfection (n = 4). Values are normalized to the mock control for each luciferase-3’UTR construct. Statistical analyses were performed by two-tailed students t-test; *P < 0.05 vs SCR controls. (C) Relative mRNA expression of validated targets, from (B), using a previously published dataset [27]. Note that only TSC1 shows significant downregulation compared to normal MM. Statistical analyses were performed by two-tailed students t-test; *P < 0.05 vs MM. (D) TSC1 Western blot in UT1 and LMS1 cell lines 48 h after miR-130b or SCR control transfection. Numbers indicate relative TSC1 band intensities of miR-130b-transfected groups versus SCR controls after normalizing using tubulin levels. (E) S1-S4 luciferase reporter constructs for identification of functional miR-130b sites in the TSC1 3’UTR. (F) Relative luciferase activities of S1-S4 constructs in 293T cells following mock, SCR or miR-130b transfection (as in panel B) (n = 4). (G) Relative luciferase activities of S1-S4 constructs in LMS1 cells following mock, ctrl HI or miR-130b HI transfection (n = 4). (H) MiR-130b binding site sequences in wild type (S3 and S4) and mutant (S3_mut and S4_mut) constructs. Shaded text indicates predicted MiR-130b binding sites within the wild type sequences. Red text indicates seed region. (I) Relative luciferase activities of wild type and mutant S3 and S4 constructs in 293T cells following mock, SCR or miR-130b transfection (n = 4). (J) Relative luciferase activities of wild type and mutant S3 and S4 constructs in LMS1 cells following mock, ctrl HI or miR-130b HI transfection (n = 4). Statistical analyses (F, G, I, J) were performed by two-tailed students t-test; *P < 0.05, **P < 0.005, ***P < 0.001 vs SCR or Ctrl HI. Values are normalized to the mock controls for each luciferase construct.

