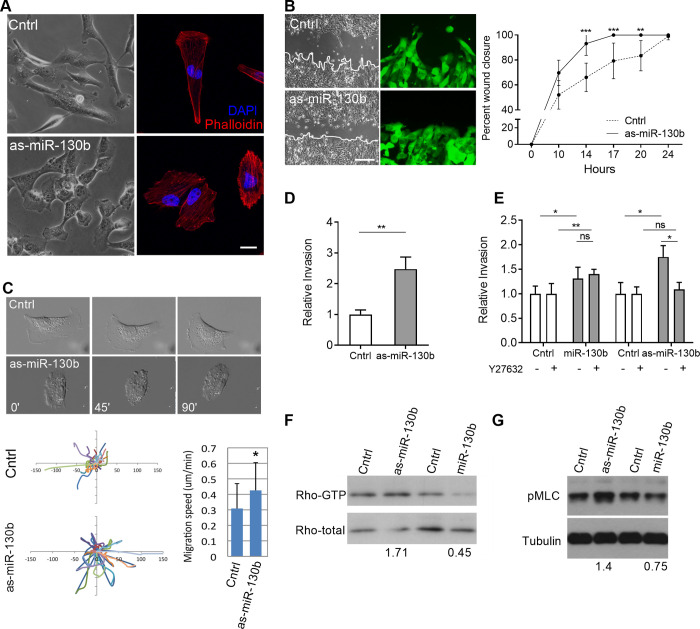
Fig 5. MiR-130b levels regulate LMS cell morphology, migratory and invasive behavior and Rho signaling.
(A) Representative bright field (left panels) and immunofluorescence (right panels, red = phalloidin, blue = DAPI) images of LMS cells transduced with the anti-sense sequence of miR-130b (as-miR-130b) or control vector (Cntrl). Scale bar: 20 μm. (B) Scratch assay of control and as-miR-130b transduced LMS1 cells showing percentage of wound closure (relative to t = 0) over 24 h (n = 3). Representative bright field and fluorescent images (left panels) of scratch area showing prevalent leading-edge protrusions in control but not as-miR-130b transduced cells (arrowheads). Scale bar: 100 μm (C) Still images of time-lapse video microscopy of control and as-miR-130b transduced cells (upper panels), depicting a loss of lamellipodia and elongated cell morphology following miR-130b inhibition. Track plots indicating migration paths of individual cells (n = 25) from a single origin (center of axes) in control and as-miR-130b groups (bottom panel, left). Average migration speed (bottom panel, right) calculated by Image J. (D) Transwell assay showing relative invasion of as-miR-130b and control transduced LMS1 cells after 18 h. Cells were counted on membrane inserts after crystal violet staining. Cell counts were normalized to the control group. (E) Transwell assays showing relative invasion in the absence (-) or presence (+) of the ROCK inhibitor Y27632 (ROCKi). All invasion assays were performed in triplicate. Cell counts were normalized to the control groups without Y27632. (F) Rho-GTP levels in LMS1 cells by pull down assay following miR-130b down-regulation (as-miR-130b) and overexpression (miR-130b) relative to controls. Numbers indicate relative Rho-GTP band intensities of as-miR-130b and miR-130b groups versus control groups after normalization to total Rho levels. (G) Immunoblot of pMLC and tubulin in corresponding cell cultures. Numbers indicate relative pMLC band intensities of as-miR-130b and miR-130b groups versus control groups after normalization to tubulin levels. Statistical analyses were performed by two-tailed students t-test; *P < 0.05, ** P < 0.005, *** P < 0.001.

