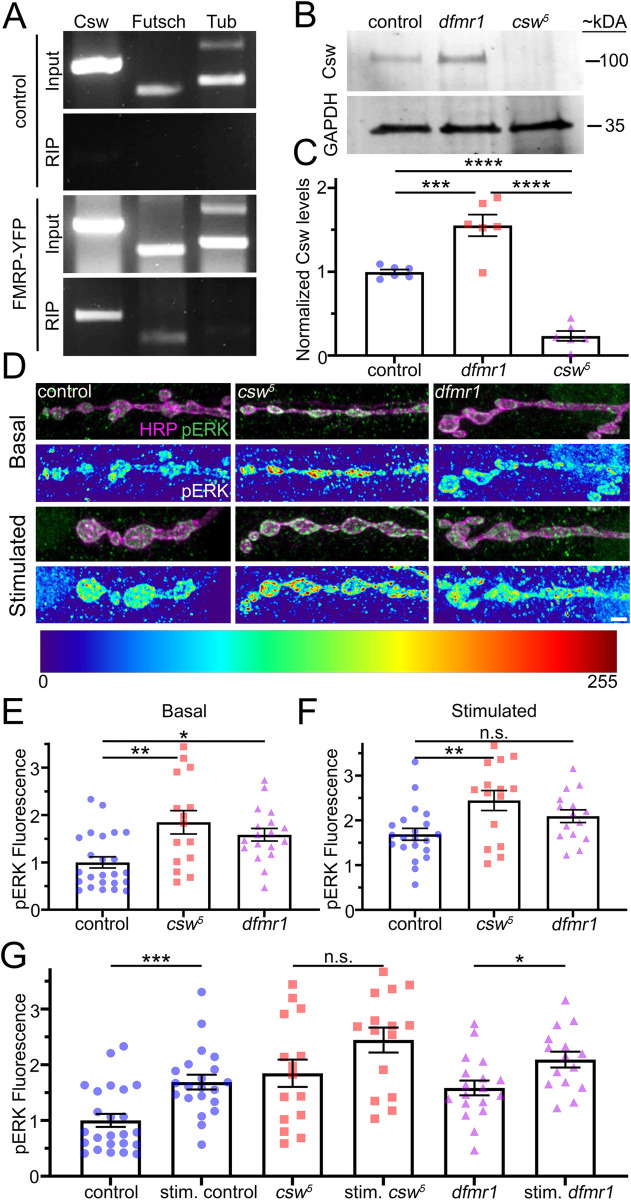
Fig 6. FMRP binds csw mRNA to elevate neuronal Csw and presynaptic pERK levels.
(A) RIP control (Tubby::GFP, top) and FMRP (FMRP::YFP, bottom), with csw, futsch (positive control), and α-tubulin (negative control) RNAs. (B) Western blot for Csw (100 kDa, top) and GAPDH control (35 kDA, bottom) w1118 control, dfmr150M null, and csw5 null. (C) Quantification of Csw levels normalized to GAPDH using one-way ANOVA followed by Tukey’s multiple comparisons. (D) Representative NMJ images of w1118 control, csw5 null, and dfmr150M null colabeled for pERK (green) and presynaptic membrane marker anti-HRP (magenta). pERK fluorescence shown as a heat map. NMJs shown without stimulation (basal, top) and with 90 mM [K+] HFS (high K+, bottom). Scale bar: 2.5 μm. (E) Quantified normalized basal presynaptic anti-pERK fluorescence for all 3 genotypes using one-way ANOVA and Tukey’s multiple comparisons. (F) Quantified normalized stimulated presynaptic anti-pERK fluorescence using one-way ANOVA and Tukey’s multiple comparisons. (G) Quantification of normalized presynaptic pERK levels in all 3 genotypes under basal and stimulated conditions using two-sided t tests. Scatter plots show all data points and mean ± SEM. N = number of animals (C) or NMJS (E-G). Significance: p > 0.05 (not significant, n.s.), p < 0.05 (*), p < 0.001 (**), p > 0.001 (***), and p < 0.0001 (****). The data underlying this figure can be found in S1 Data. csw, corkscrew; FMRP, Fragile X Mental Retardation Protein; GAPDH, glyceraldehyde 3-phosphate dehydrogenase; HFS, high-frequency stimulation; HRP, horseradish peroxidase; NMJ, neuromuscular junction; pERK, phosphorylated ERK; RIP, RNA-immunoprecipitation.

