
Supplementary Fig.1. Secular trends in the percentiles of anthropometric parameters.
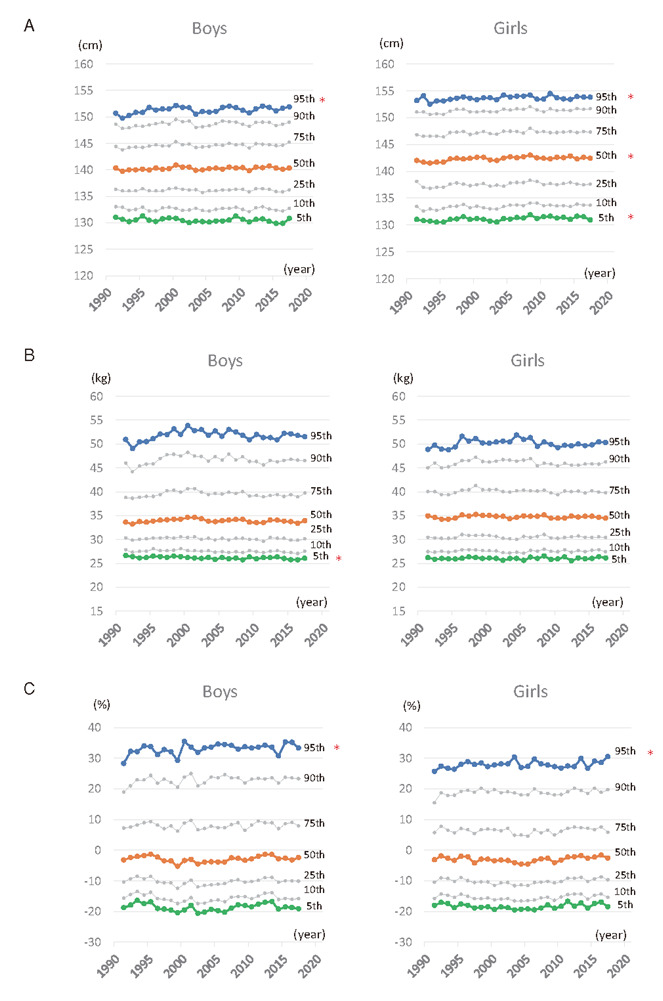
A, Height. B, Weight. C, Percentage of overweight (POW). Blue circles, 95th percentile; orange circles, 50th percentile; and green circles, 5th percentile. Gray circles, 10th, 25th, 75th, and 90th percentiles. Secular trends in the 5th, 50th, and 95th percentiles were statistically analyzed. *P<0.05.