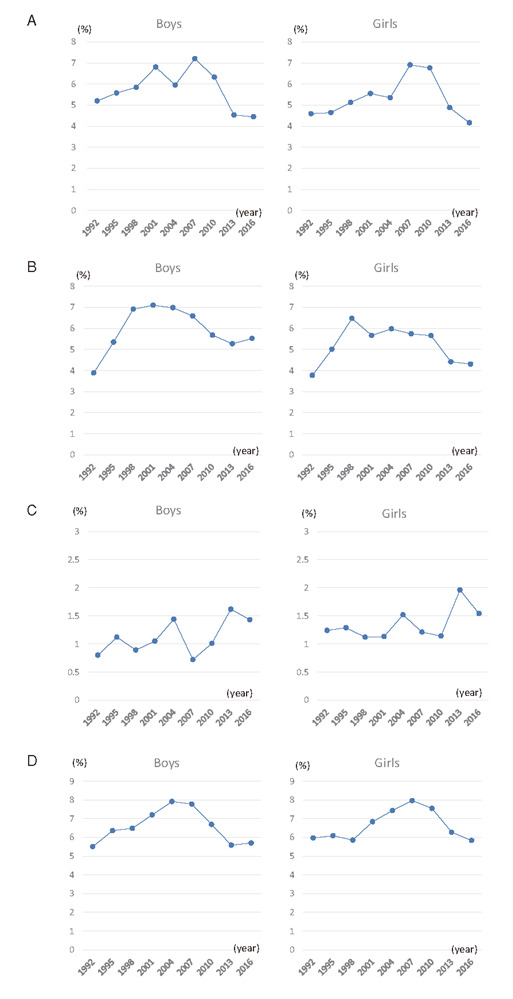
Fig.2. Secular trends in the percentage of children with inappropriate levels of lipids.

A, TC ≥ 220 mg/dl; B, TG ≥ 140 mg/dl; C, HDL-C <40 mg/dl; and D, non-HDL-C ≥ 150 mg/dl. Left side, boys; right side, girls. Data obtained every three years are serially shown.
