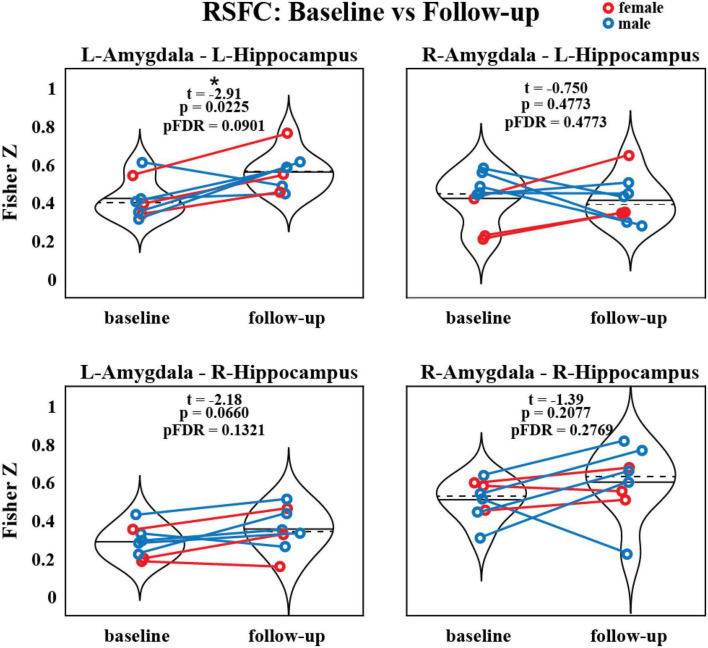
FIGURE 3.
Resting-state functional connectivity between the amygdala and hippocampus before and after MDMA-AT. P-values from a two-sided, paired t-test. Blue = male. Red = female. Black solid and dashed lines indicate group means and medians, respectively (N = 8; t-statistics indicate baseline > follow-up; *uncorrected p < 0.05).

