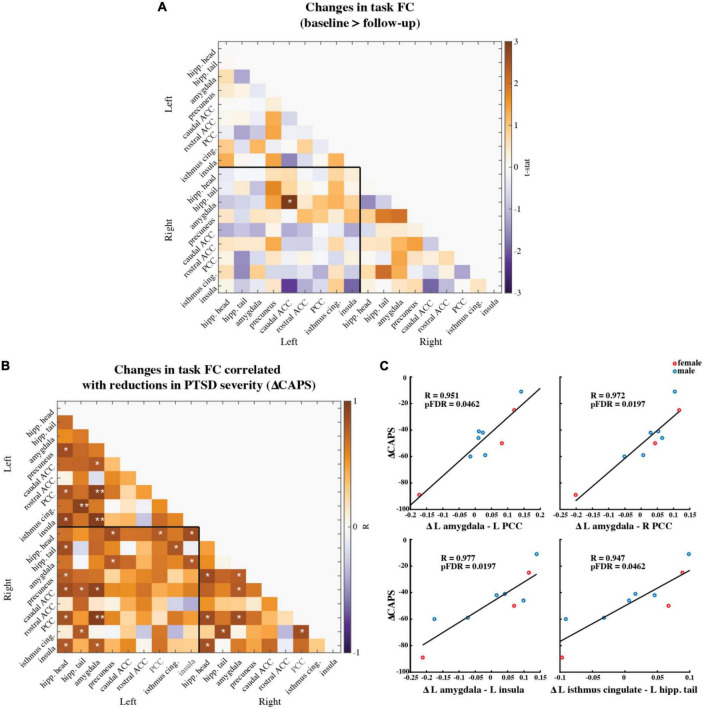
FIGURE 5.
(A) Paired t-statistics shown for differences in functional connectivity between all brain regions of interest during the task fMRI scan involving neutral and trauma memory audio listening (N = 9; baseline > follow-up; *two-sided uncorrected p < 0.05; **pFDR < 0.05, corrected). (B) Pearson correlation values between changes in ROI functional connectivity and reduction in CAPS scores. Changes were calculated as follow-up values minus baseline values. (N = 9; *uncorrected p < 0.05; **pFDR < 0.05) Age and mean FD difference between baseline and follow-up were included as covariates of non-interest. (C) Scatter plots of the three correlations that remained significant after corrections for multiple comparisons (i.e., pFDR < 0.05). Red marker = female. Blue marker = male.

