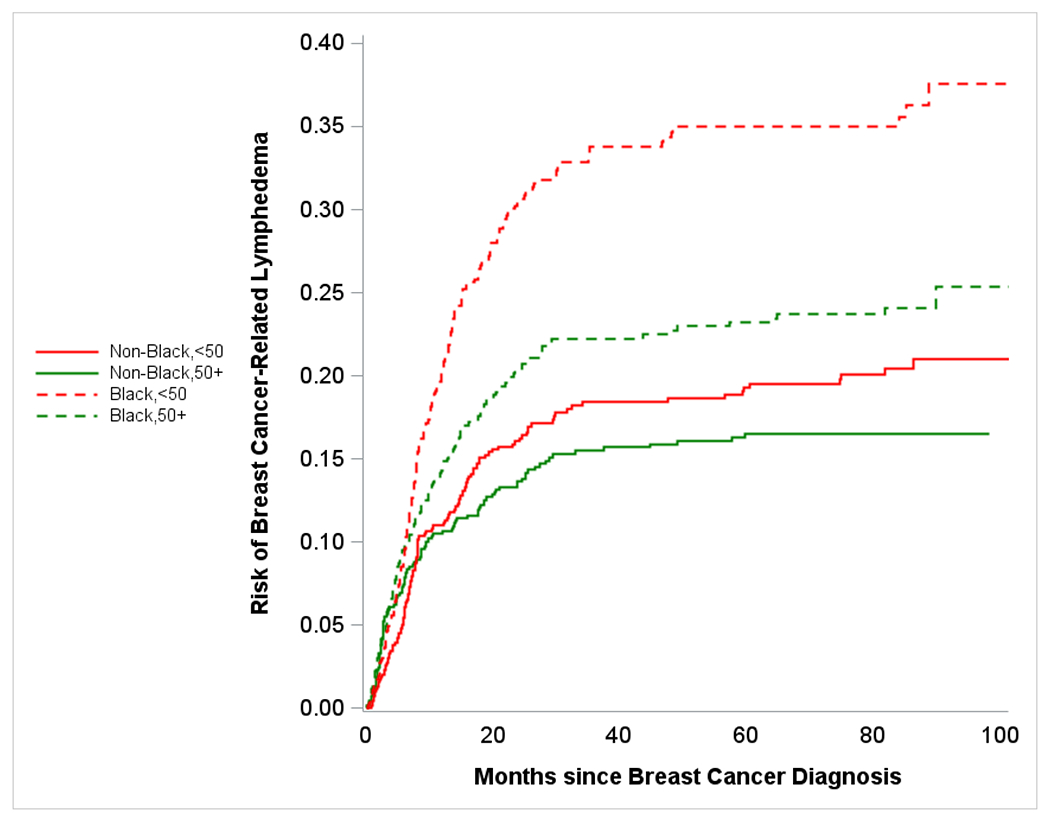
Figure 1c.

Plot shows crude risk of breast cancer-related lymphedema following surgery among women with breast cancer (stage I-III) stratified by race and age - Carolina Breast Cancer Study (Phase 3, diagnosis years 2008-2013). Red dashed line represents risk over time for younger (<50 years in age) Black participants, green dashed line represents risk over time of older (≥50 years in age) Black participants, red solid line represents risk over time for younger non-Black participants, green solid line represents risk over time of older non-Black participants.
