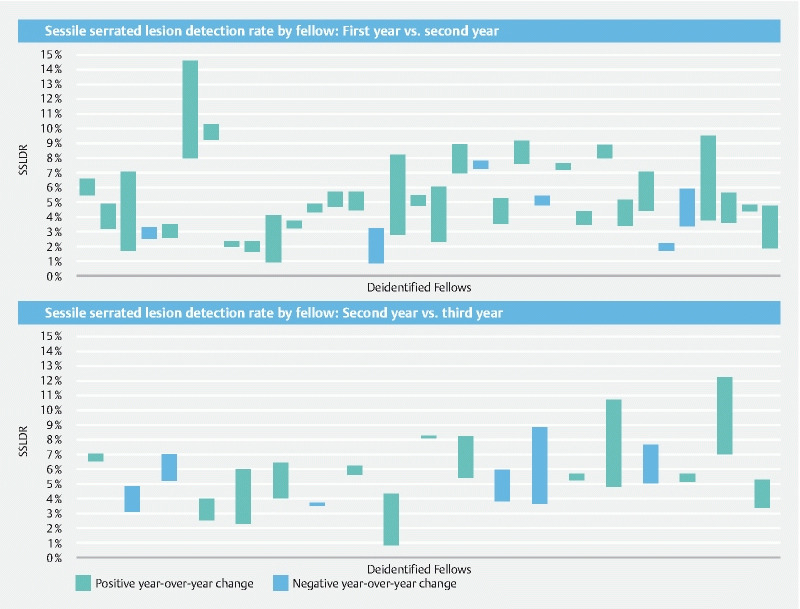
Fig. 3.

Sessile serrated lesions detection rate by fellow: first year vs. second year (top) and second year vs. third year (bottom). Each column represents the year-over-year percentage change in sessile serrated lesion detection rate (SSLDR) of an individual fellow. Striped columns represent positive year-over-year change (improvement) is SSLDR while checkered columns represent negative year-over-year change (diminishment).
