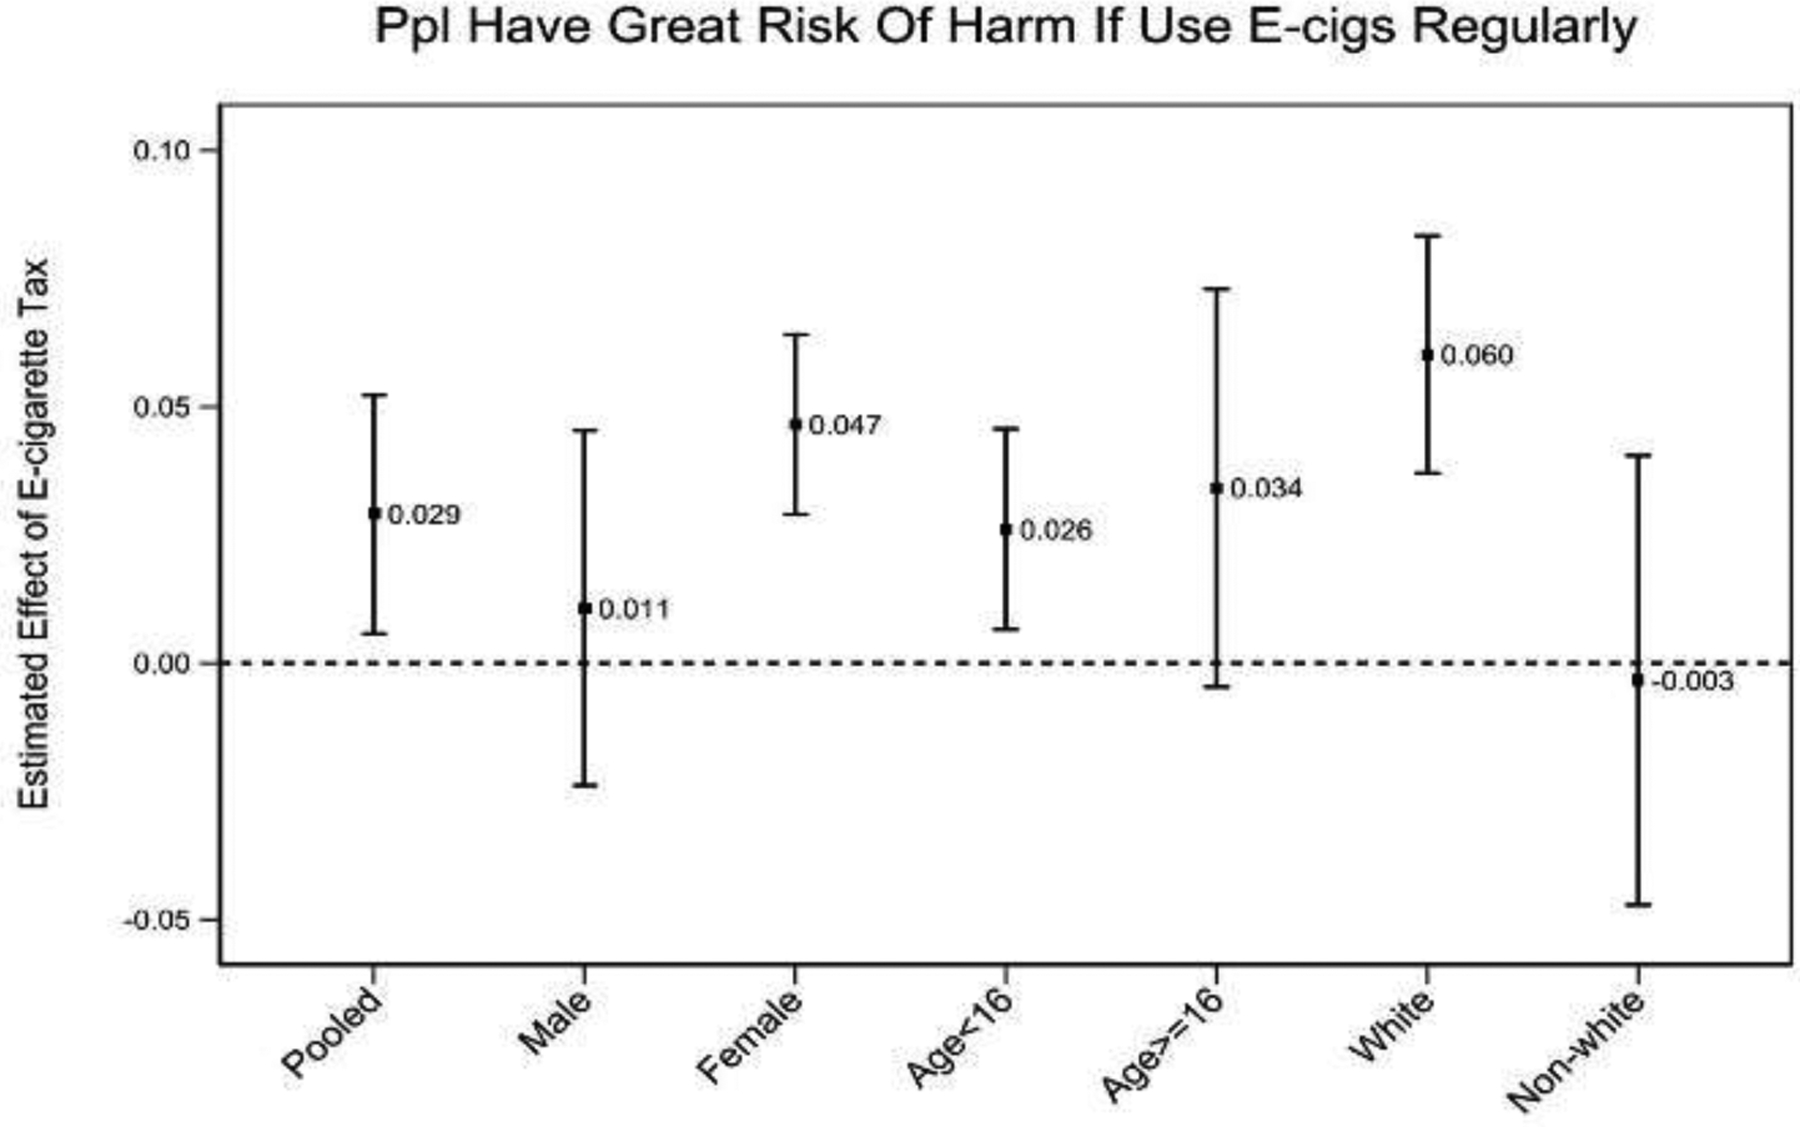
Figure 4:

Heterogeneity Check, Box-Whisker Graphs for Standardized ENDS Tax Rate (MTF)
Notes: Estimated treatment effects are shown along with vertical bars depicting their 90% confidence intervals.

Heterogeneity Check, Box-Whisker Graphs for Standardized ENDS Tax Rate (MTF)
Notes: Estimated treatment effects are shown along with vertical bars depicting their 90% confidence intervals.