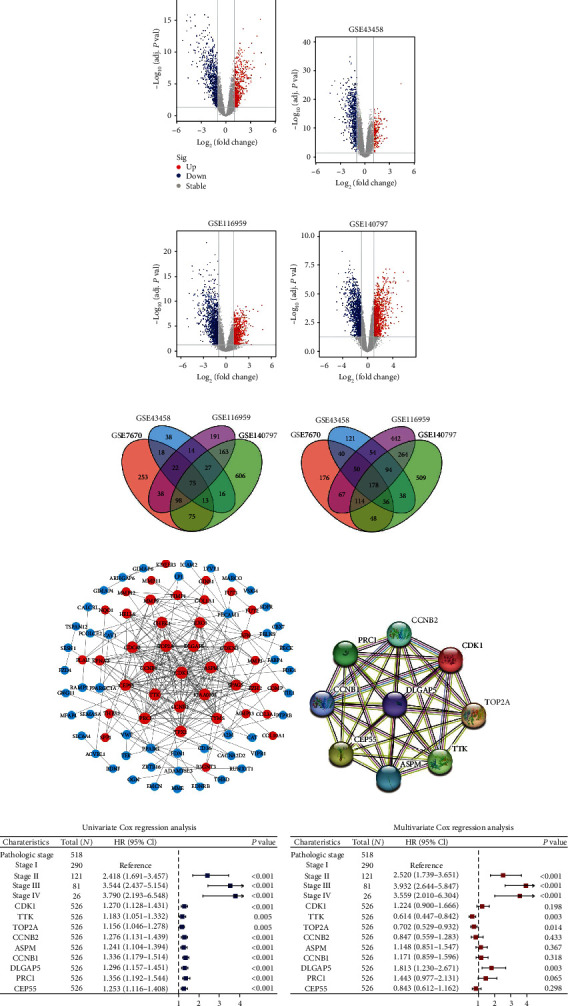
Figure 2.

Screening of oncogenes in LUAD. (a–d) Volcano plots of differential gene expression matrices for GSE7670, GSE43458, GSE116959, and GSE140797, respectively. (e, f) Venn plots of up- and downregulated overlapping DEGs. (g) The overlapping DEGs constructed a PPI network. Red nodes indicated the upregulated DEGs, and blue nodes represented the downregulated DEGs. (h) Highly connected DEGs were extracted and reconstructed as a PPI network using the STRING online database. (i, j) Univariate and multivariate Cox regression analyses were performed to further screen LUAD for key oncogene using the TCGA database.
