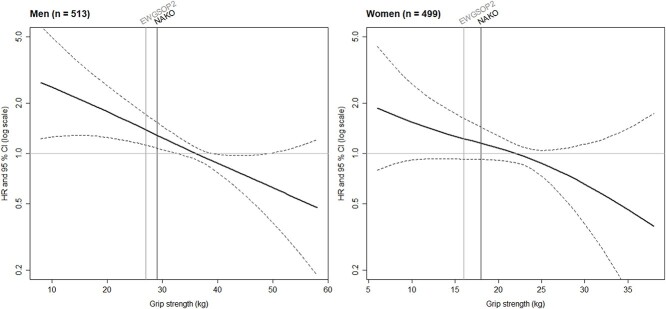
Figure 2.
Association of grip strength with all-cause mortality by Cox regression with penalised splines in the KORA-Age sample. Solid black curve indicates the hazard ratio for all-cause mortality and dashed black curves depict the corresponding 95% confidence intervals. The reference (hazard ratio = 1) was represented by the median of the grip strength (men: 36 kg, women: 22 kg). Grey vertical line shows the cut-off point of the EWGSOP2 sarcopenia definition for low grip strength (men: 27 kg and women: 16 kg [6]) and black vertical line represents the cut-off point for low grip strength calculated based on the NAKO data (men: 29 kg and women: 18 kg). The y-axis is presented as a log scale. Cox regression models with grip strength as a penalised spline term were adjusted for body mass index (penalised spline term), age, physical activity scale for the elderly: total score, smoking, education, estimated glomerular filtration rate, albumin, lung disease (asthma, emphysema, COPD), cancer within the last three years, diabetes mellitus, heart problems or disease, and neurological disease (without stroke). CI: confidence interval, COPD: chronic obstructive pulmonary disease, EWGSOP2: European Working Group on Sarcopenia in Older People 2, HR: hazard ratio, n: number of participants, NAKO: German National Cohort.

