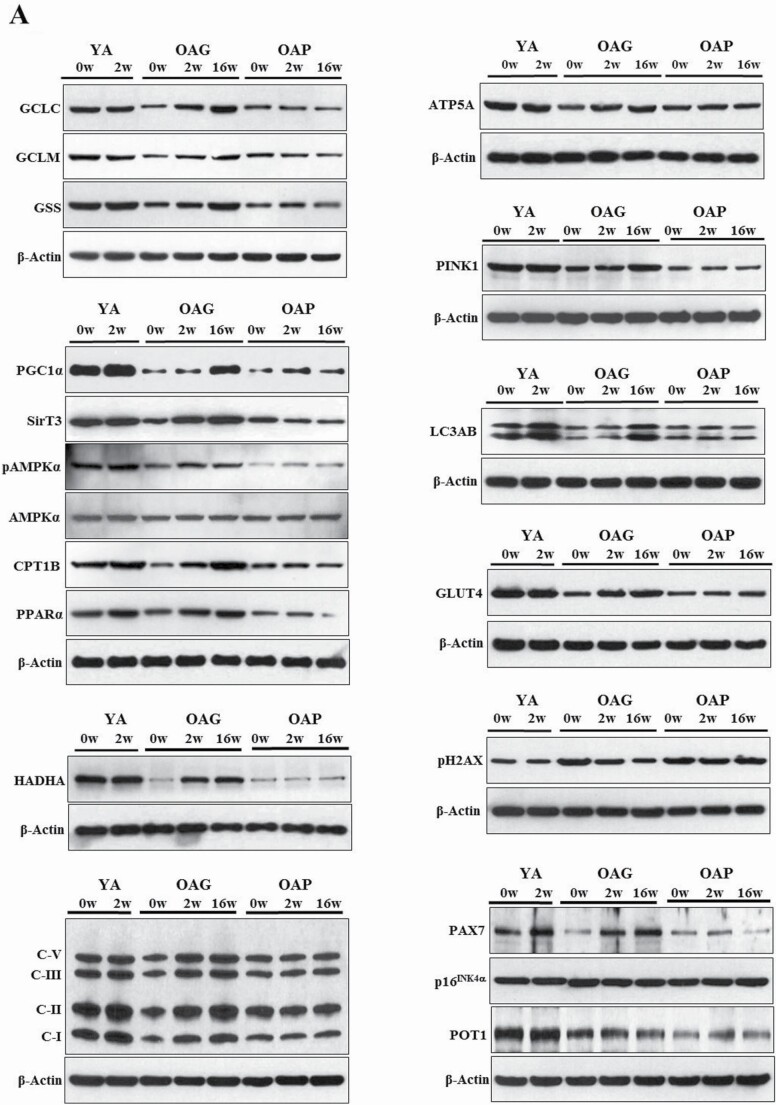
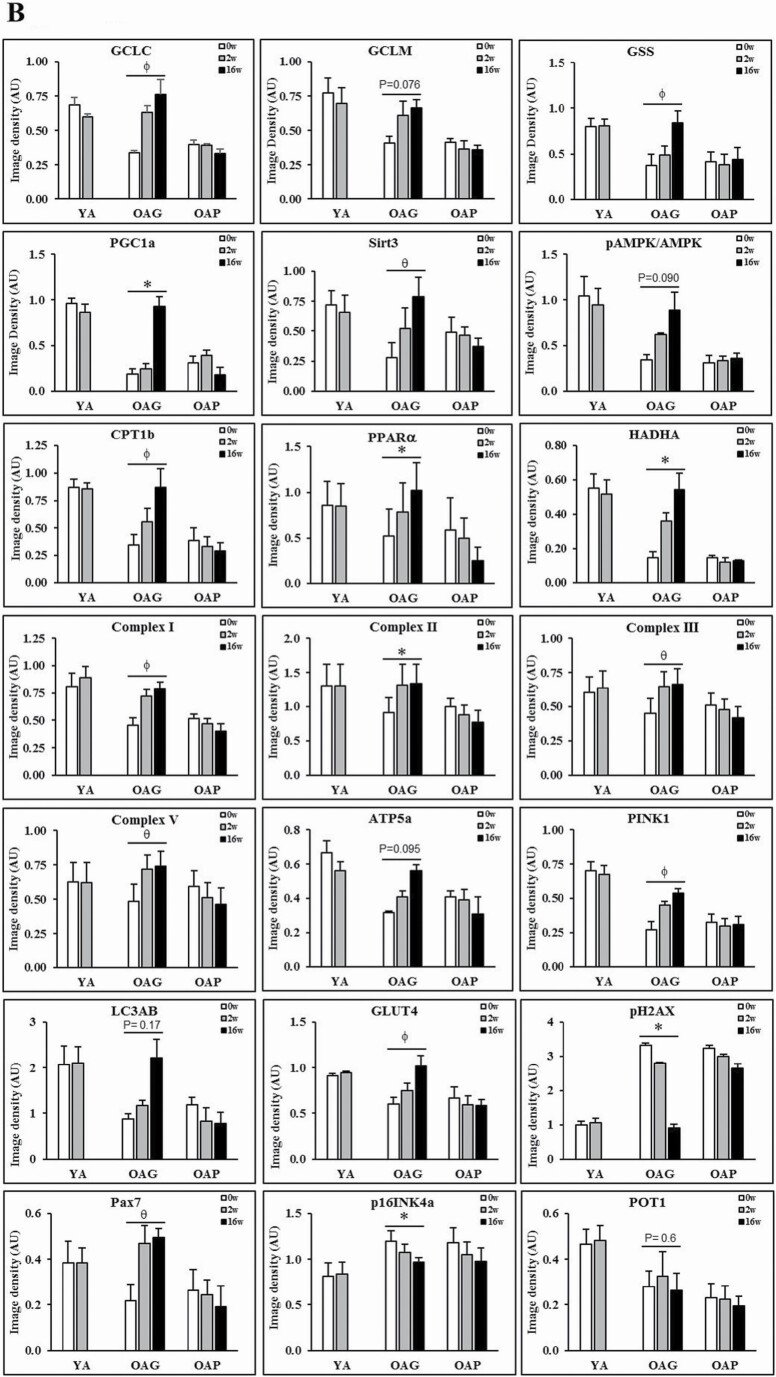
Figure 2.
(A) Western blots for protein expression; each blot represents serial biopsies one participant from YA (0w, 2w), the OAG (0w, 2w, 16w), and OAP (0w, 2w, 16w). GCLC and GCLM = Glutamate cysteine ligase catalytic and modifier subunits; GSS = Glutathione synthetase; PGC1α = PPARG coactivator 1-alpha; SirT3 = Sirtuin 3; pAMPKα = phosphorylated AMP-activated protein kinase α subunit; AMPKα = total AMP-activated protein kinase α subunit; CPT1B = Carnitine palmitoyltransferase 1B; PPARα = Peroxisome proliferator-activated receptor α; HADHA = hydroxyacyl-CoA dehydrogenase trifunctional multienzyme complex subunit α; C-I, II, III, V = mitochondrial complexes I, II, II, V; ATP5A = mitochondrial ATP synthase F1 subunit alpha; PINK1 = PTEN-induced kinase 1; LC3AB = Microtuble-associated protein light chain 3 A and B; GLUT4 = Glucose transporter type 4; pH2AX = phospho-H2A histone family member X; PAX7 = Paired box protein 7; p16INK4α = p16; POT1 = Protection of telomeres protein 1. Additional details are in methods section. (B) Quantification of Immunoblots from 3 participants per group of YA, OAP and OAG. The figure shows average optical densities of protein expression from each group normalized to the loading control (β-actin). * = p < .05; ϕ = p < .01; θ = p < .001. GlyNAC = combination of glycine and N-acetylcysteine; YA = young adults; OAG = older adults receiving GlyNAC; OAP = older adults receiving placebo.


