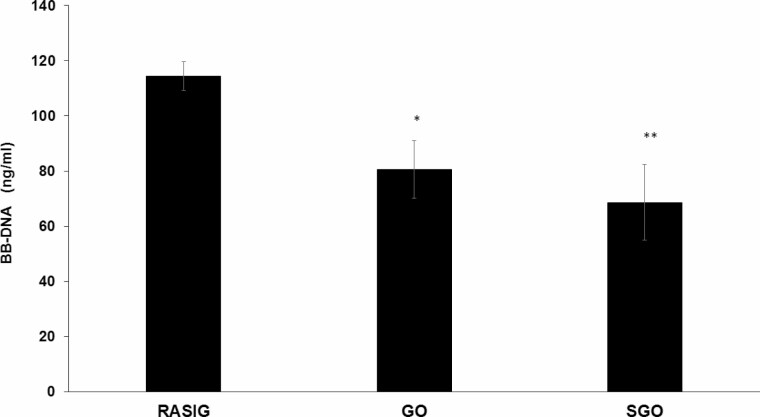
Figure 1.
Blood bacterial DNA in peripheral blood from GO, SGO, and RASIG participants. RASIG showed significantly higher BB-DNA levels when compared with the other study groups. GO and SGO participants displayed similar BB-DNA levels. ANCOVA correcting for age, countries, sex, smoke habit, and CCI was applied; data are reported from the model adjusted mean ± SEM; *p < .05 when compared with GO; **p < .01 when compared with SGO. BB-DNA = blood bacterial DNA; CCI = Charlson Comorbity Index; GO = nonagenarian offspring; RASIG = Randomly recruited Age-Stratified Individuals from the General population; SGO = spouses of GO.

