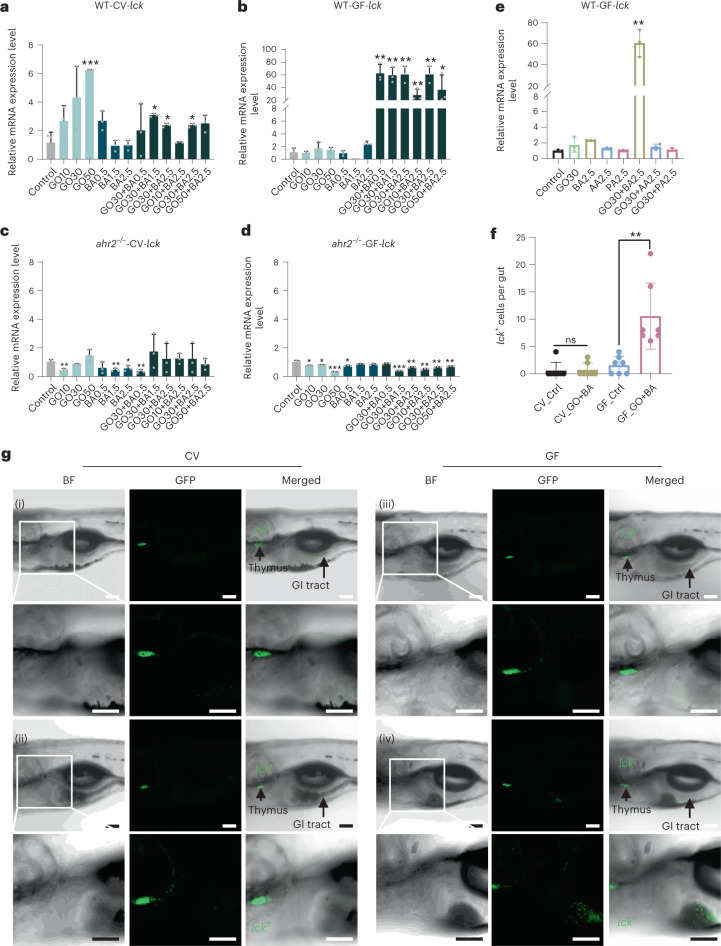
Fig. 3. GO plus BA trigger AhR-dependent homing of lck+ cells in GF fish.
a–d, Relative mRNA expression of lck in WT-CV (a), WT-GF (b), ahr2−/−-CV (c) and ahr2−/−-GF (d) zebrafish larvae on exposure to GO alone, BA alone or GO+BA at the indicated concentrations. Supplementary Fig. 10 shows the additional gene profiling results. Data are presented as mean values ± s.d. of three independent experiments (n = 3). Student’s t-test (two sided) was used for the analysis of comparisons between control and the indicated treatments (*p < 0.05, **p < 0.01, ***p < 0.001). e, PCR analysis of lck following the exposure to GO and/or various SCFAs in WT-GF zebrafish larvae. AA, acetic acid; BA, butyric acid; PA, propionic acid. Student’s t-test (two sided) was used for the comparison between control and exposed larvae (**p = 0.0014). f, Quantification of lck+ cells homing to the gut. A significant increase in lck+ cells in the gut was observed on GO+BA exposure under GF conditions, but not in CV zebrafish. Student’s t-test (two sided) was used for the analysis of comparisons between control and the treatments (ns = no significant difference; **p = 0.0055). The numbers of lck+ cells were quantified based on seven individuals per group. g, Visualization of lck+ cells using Tg(lck:GFP) zebrafish larvae under CV and GF conditions exposed as follows: (i) CV fish (control), (ii) CV fish (GO+BA), (iii) GF fish (control), (iv) GF fish (GO+BA) (Supplementary Fig. 11 shows the experiments with resorufin butyrate). Scale bars, 100 μm.

