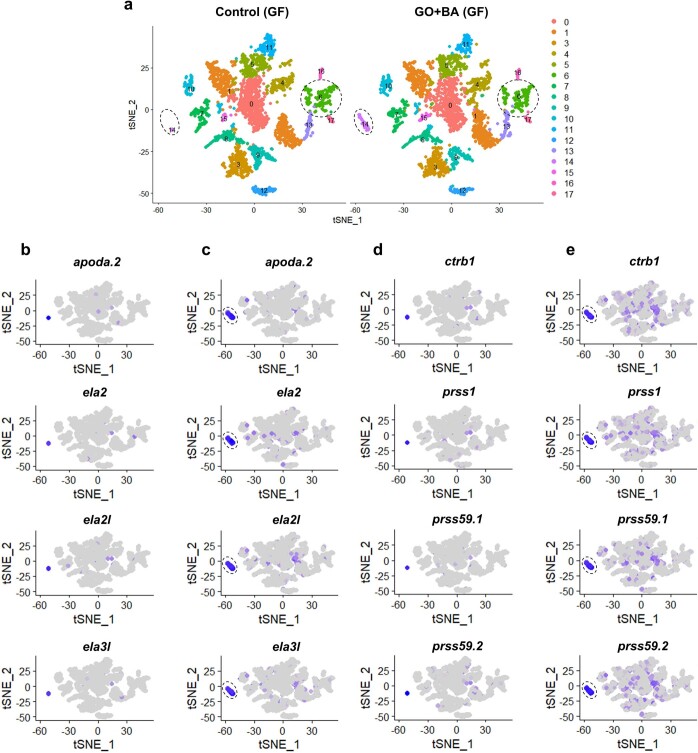
Extended Data Fig. 1. Integrated analysis of wild-type (WT) germ-free (GF) control versus GO+BA samples.
(a) 2D projection of the tSNE analysis showing lck+ lymphocytes (cluster 6) and the cluster corresponding to the liver and pancreas (cluster 14) which is noticeably expanded in the GO+ BA fish. Below are the feature plots showing the expression of genes involved in lipid metabolism (apoda.2) and proteolysis (ela3l, ela2l, ela2, ctrb1, prss1, prss59.1, prss59.2), respectively, in the GF control samples (b,d) versus GO+BA samples (c,e).

