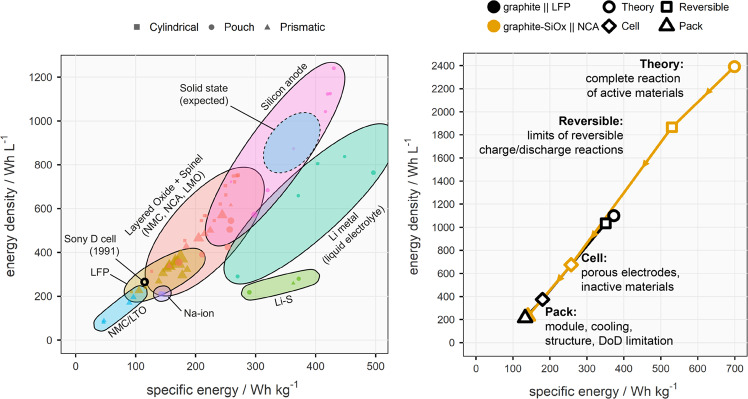
Fig. 3. Visual representation of the range of energy content of different battery technologies at the cell level and energy losses between theory and system level.
Left) energy density vs specific energy for selected Li-ion and “post-Li-ion” cells from publicly available specifications; right) schematic of the reduction in energy on a weight and volume basis between the theoretical maximum for the active materials and usable pack-level energy density for state-of-the-art NCA and LFP battery technologies. The symbols on the left chart are scaled based on cell size in terms of Ah. The data on which this figure is based are reported in Supplementary Note 1. Error bars are smaller than the data points for Fig. 3 right, and the reader is referred to Supplementary Note 1 for the range of values used. “DoD” refers to “depth of discharge”, the utilized fraction of the battery’s nominal capacity.

