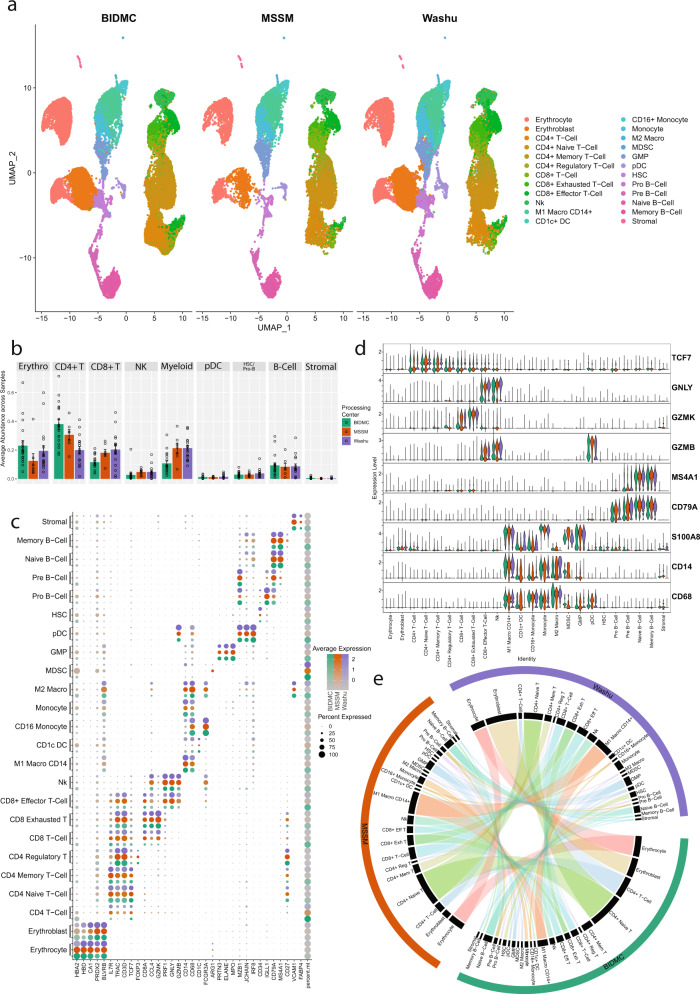
Fig. 2. Comparison of scRNA profiles of samples processed at three different centers.
Bone marrow aspirates from the same set of patients were processed at three different centers, BIDMC, MSSM, and WashU, and analyzed using a uniform bioinformatics workflow for comparative analysis. The comparative analysis was performed on 20 samples processed at BIDMC, 7 processed at MSSM, and 21 processed at WashU. a Split UMAP based on sample processing centers of scRNA samples. All major cell types are captured in the single-cell profile from each center. Clusters are colored based on cell types identified in Fig. 1a. b Comparative analysis of cell type proportion across centers. Each bar represents the mean ratio for a given cell type for all samples processed at a specific center. Error bars show the standard error of the mean. Individual dots represent individual patient cell type ratios. Samples from MSSM and WashU had similar ratios across the cell types. BIDMC shows a higher proportion of CD4+ T-cells and a lower ratio of Myeloid cells. c Comparative analysis of canonical cell type-specific markers across three centers. Most of the cell type defining markers are concordantly expressed across cell types indicating strong similarity in the single-cell profiles generated across centers. BIDMC, which performed CITE-Seq, tends to have higher percent.mt relative to other centers this might be due to longer processing time for CITE-Seq due to antibody labeling. d Violin Plots comparing the expression of various cell markers among different centers. Overall, the level of expression of these markers are consistent among centers indicating no batch effect or center-based expression artifact. e A Circos plot showing the correlation between expression profiles of cell types profiled at different centers. The individual cell types across centers depict significant similarity in the expression profiles. Some cell types with lower correlations include CD4+ memory T-cells from BIDMC, and monocytes and CD1c+ DCs from WashU.

