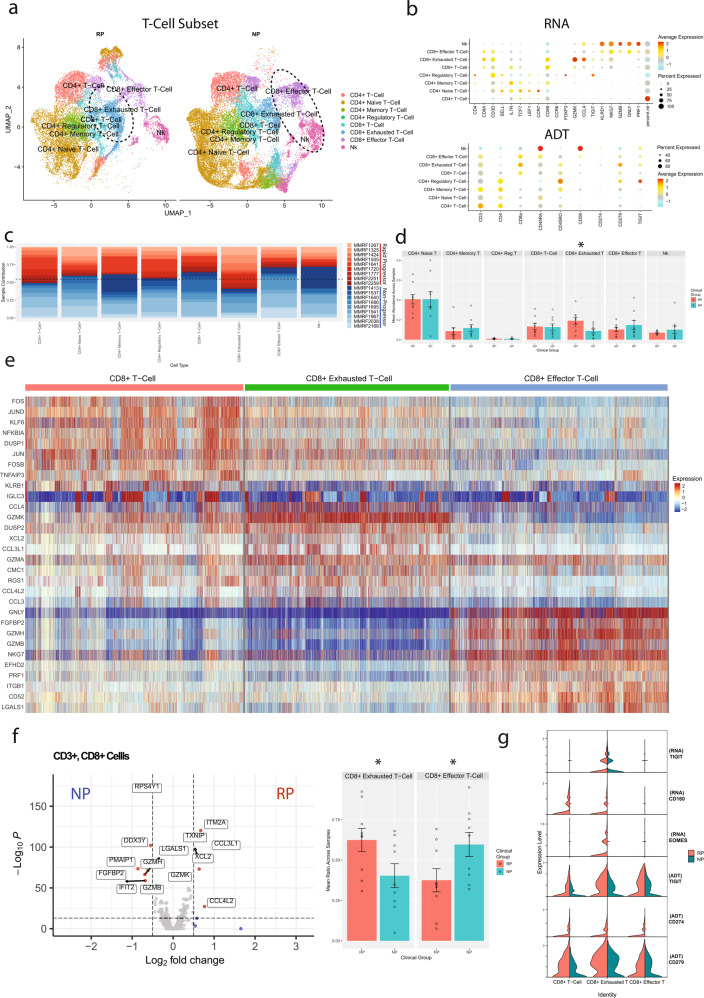
Fig. 3. Comparative analysis of T and NK cell subpopulations in multiple myeloma patients with rapid- and no- progression of the disease.
a A UMAP displaying the T-cell subclusters split based on clinical groups (i.e., NP, RP). Subclusters were manually labeled as CD4+ T-cells (naive, memory, regulatory), CD8+ T-cells (memory, exhausted, effector), or NK cells based on the expression of specific markers. Limited CITE-Seq data from BIDMC was used to confirm some cellular annotations. NK and CD8+ effector T-cells show elevated counts from NP samples, while RP samples contain higher counts of CD8+ exhausted T-cells. b Dot plot demonstrating the expression profile of key markers for each T-cell subtype from both the scRNA-seq and CITE-Seq (ADT) assays. Markers for cell types used were CD4+ T-cells (CD4+), CD4+ naive T-cells (CD4+, TCF7+, CCR7+, CD45RO+), CD4+ Memory T-cells (CD4+,IL7R+, CD45RA+), CD4+ regulatory T-cells (CD4+, FOXP3+), CD8+ T-cell (CD8A+, KLRB1+, IL7R+, GATA3+, GZMK low), CD8+ exhausted T-cells (CD8A+, GZMK+, TIGIT+), CD8+ effector T-cells (CD3D+, GNLY+, GZMB+), and NK cells (CD3D-, GNLY+, GZMB+). c The patient contribution to each cell type cluster indicates that most of the clusters consist of cells from multiple patients. The patients from RP and NP groups are shown with shades of red and blue respectively. d Comparative analysis of the T-cell types enriched in the RP and NP T-cell subsets. Each bar plot depicts mean and standard error of mean. Significant enrichment (P = 0.022) of the CD8+ exhausted T-cells was observed in the RP population. e Differential expression analysis of the three CD8+ T-cell subtypes (CD8+ memory T-cells, CD8+ exhausted T-cells, CD8+ effector T-cells). Columns represent individual cells, grouped by cell type, while rows display individual genes. CD8+ T-cells depicted upregulation of markers related to T-cell memory, such as IL7R, but has under-expression of cytotoxic markers such as GZMK, GZMB, or NKG7 as compared to other CD8 T-cell subtypes. CD8+ exhausted T-cells depicted upregulation of GZMK and multiple genes related to chemokine signaling, such as CCL3 and XCL2. CD8+ effector T-cells showed downregulation of GZMK and upregulation of GZMB and GZMH, along with cytotoxic markers such as PRF1 and GNLY. f Comparative analysis of the CD8+ subset between NP and RP groups. Differential expression analysis was performed based on the Wilcoxon rank sum test of NP and RP CD8+ T-cells. NP CD8+ T-cells showed upregulation of markers related to NK cells, such as GZMB and GZMH. RP CD8+ T-cells instead show upregulation of the CD8+ exhausted T-cell markers, specifically chemokines like CCL3L1 and XCL2. These differences are reflected in the average cell type ratios in the CD8+ subset in NP and RP samples. The ratio of these CD8+ exhausted T-cells to the GZMB+ effector cells is significantly higher in RP samples (P = 0.048). g Expression profile of markers of exhaustion in the CD8+ and NK subsets. CD8+ exhausted T-cells, predominantly found in the RP group, show the highest expression of TIGIT and EOMES in the RNA assay relative to other CD8+ T-cells. CD160 is detectable in CD8+ T-cells and CD8+ exhausted T-cells, though only in samples from the RP population. CITE-Seq confirms elevated expression of TIGIT and PD-1 (CD279) in the CD8+ exhausted T-cell cluster, and general enrichment of exhaustion markers in the RP group over the NP group across multiple CD8+ cell types.

