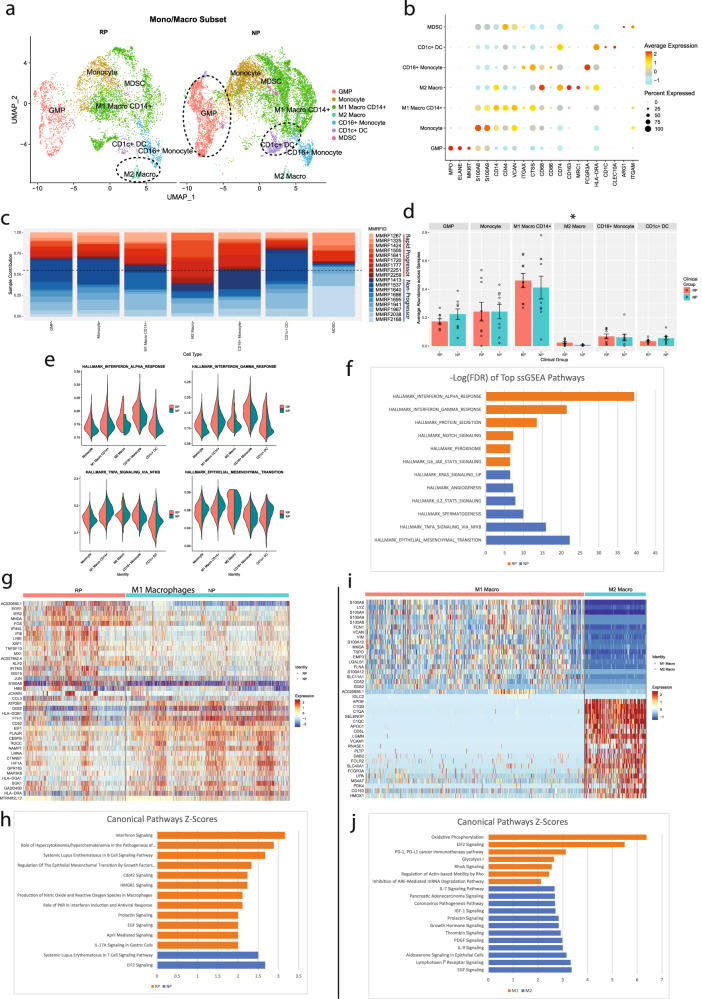
Fig. 4. Comparative analysis of the “monocyte and macrophage” and “GMP” immune microenvironment cell subpopulations in multiple myeloma patients with rapid- and no- progression of the disease.
a A UMAP displaying the monocyte and macrophage subcluster split based on clinical groups (NP and RP). Subclusters were labeled as either Granulocyte-Monocyte Progenitors (GMP), monocyte, CD16 + monocytes, M1 macrophages, M2 macrophage, MDSCs, or CD1c + dendritic cells (DC) based on expression of specific markers. GMP and CD1c + DCs show elevated counts in NP samples. b Dot plot demonstrating the key markers for the monocyte and macrophage subtypes. Markers to identify cell types include GMP (MPO+, ELANE+, MKI67+), monocytes (CD14+, S100A9+, S100A12+), M1 macrophages (CD14+, CD44+), M2 macrophages (CD163+, MRC1+), MDSCs (HLA-DRA low, ITGAM+, ARG1+), CD16 + monocytes (CD14-, FCGR3A+), and CD1c+ DCs (CD1c+). c The patient contribution to each cell type cluster indicating most of the clusters consist of cells from multiple patients. The patients from the RP and NP groups are shown with shades of red and blue. Overall, the NP group had a higher proportion of monocytes and macrophages relative to the RP group. d Comparative analysis of the myeloid cell types in the RP and NP myeloid subset. Each bar plot depicts the mean proportion of a specific cell type across clinical groups, with error bars displaying standard error of the mean. Individual dots show individual patient samples. M2 macrophages were significantly enriched (P = 0.045) within the RP population. e Pathway enrichment analysis on the monocyte and macrophage clusters. The Violin plots display the ssGSEA enrichment score of significantly differentially enriched pathways/gene sets between RP and NP groups. The RP group showed significant enrichment of interferon alpha and interferon gamma signaling pathways, while the NP group showed enrichment for TNF signaling and epithelial-mesenchymal transition pathways. f A bar graph displaying the top differentially enriched genesets of the monocyte and macrophage clusters based on FDR analysis between NP and RP is also shown. g A heatmap, displaying the top differentially expressed markers genes for NP and RP M1 macrophages. Columns represent individual cells, grouped by the RP or NP clinical groups, while rows display individual genes. Relative gene expression is shown in pseudo color, where blue represents downregulation, and red represents upregulation. h Selected pathways that are significantly (P < 0.01) enriched in the markers differentially expressed in the RP and NP M1 macrophage groups. Each bar represents a pathway with significant activation and inhibition in the RP group based on Z-score calculated using the IPA analysis platform. The pathways that are significantly activated (Z-score > 2) and inhibited (Z-score < −2) in the RP group are shown with orange and blue bars, respectively. i A heatmap, displaying the top differentially expressed genes for M1 and M2 macrophages. Columns represent individual cells, grouped by the type of macrophage (i.e., M1, M2), while rows display individual genes. Relative gene expression is shown in pseudo color, where blue represents downregulation, and red represents upregulation. j Selected pathways that are significantly (P < 0.01) enriched in the markers differentially expressed in the M1 and M2 macrophages. Each bar represents a pathway with significant activation and inhibition in the M1 macrophages group based on Z-score calculated using the IPA analysis platform. The pathways that are significantly activated and inhibited in the M1 macrophages are shown with orange and blue bars, respectively.

