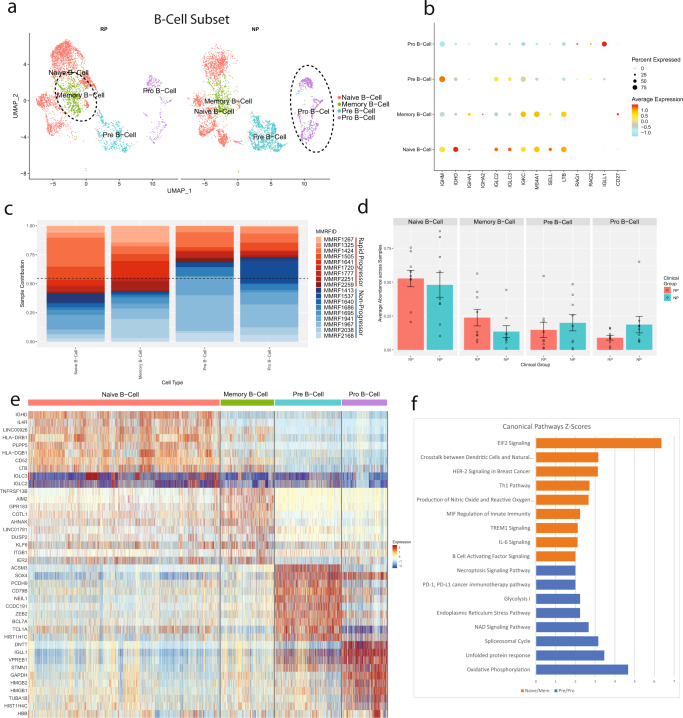
Fig. 5. Progenitor and precursor B-Cells are enriched in the multiple myeloma patients with no progression of the disease.
a A UMAP displaying the B Cell subcluster split based on clinical groups (NP and RP). Subclusters were labeled as either pro B-cell, pre B-cell, memory B-cell, or naive B-cell based on expression of specific markers. b A dot plot displaying the key markers used to identify each B cell subtype. Naive B-cells were identified via the expression of MS4A1, SELL, and LTB. Memory B-cells were identified by expression of CD27. Pre B-cells were identified by low MS4A1 expression. Pro B-cells were identified by the expression of RAG1, RAG2, and IGL11. c The patient contribution to each cell type indicates most of the clusters consist of cells from multiple patients. The patients from the RP and NP groups are shown with shades of red and blue respectively. The majority of naive and memory B-cells are derived from samples of the RP group, while the majority of pre and progenitor B-cells are derived from samples of the NP group. d Comparative analysis of the B-cell types/subtypes in the RP and NP clinical groups. Each bar plot depicts average abundance across patients and error bars show the standard error of the mean. Individual dots represent the abundance of a cell type within an individual sample. Within the B-cell subtypes, there is no significant difference in the average patient ratio. e A heatmap, displaying the top differentially expressed marker genes for naive B-cells, memory B-cells, pre B-cells, and pro B-cells. Relative gene expression is shown in pseudo color, where blue represents downregulation, and red represents upregulation. f Pathway analysis was performed on the differentially expressed markers between mature and memory B-cell groups versus the pre and pro B-cells. Selected pathways that are significantly (P-value < 0.01) enriched in these markers are displayed in the bar chart. Each bar represents a pathway with significant activation and inhibition in naive or memory B-cells based on Z-score calculated using the IPA analysis platform. The pathways that are significantly activated and inhibited in the naive and memory B-cells are shown with orange and blue bars respectively.

