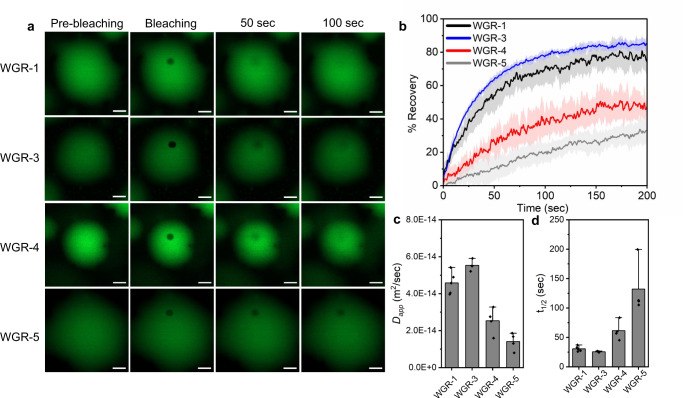
Fig. 3. Strength of intermolecular interactions affects peptide droplet dynamics.
a–c FRAP analysis of WGR-1, WGR-3, WGR-4, and WGR-5, performed using laser scanning confocal microscopy at 20 mM in Tris buffer at pH 8 with 0.2 M NaCl using 0.5% FITC-labeled peptides. a Representative confocal microscopy images of FRAP for individual droplets. Scale bars = 5 μm. FRAP recovery plots (b), apparent diffusion coefficient (c), and t1/2 of the recovery (d). Data are presented as mean values +/− SD, n = 5 (WGR-1), 4 (WGR-3, WGR-4), and 5 (WGR-5). Source data are provided as a Source Data file.

