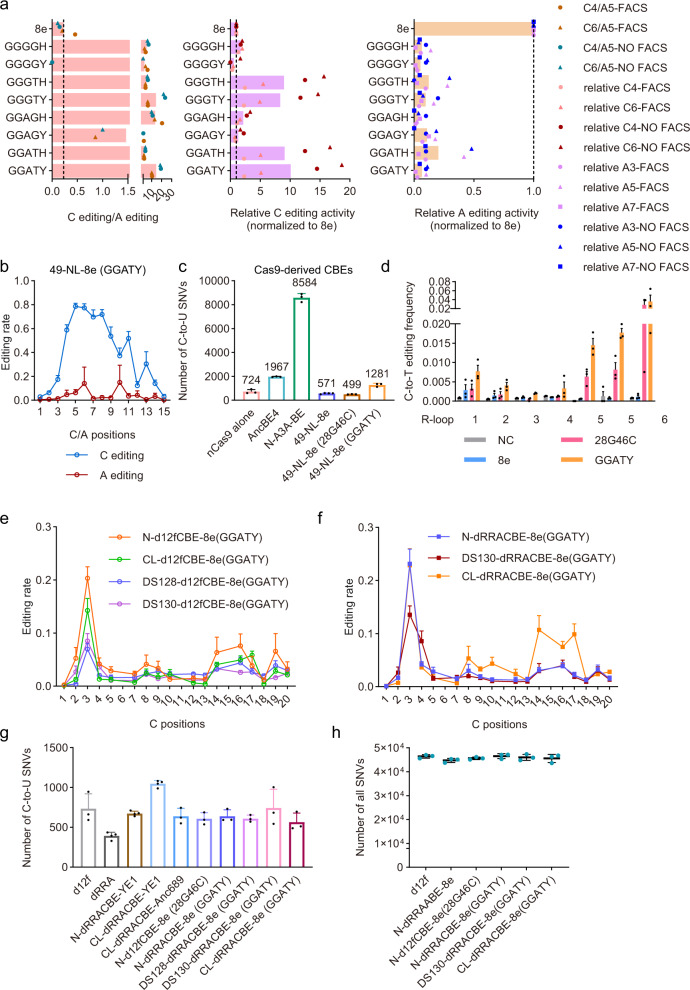
Fig. 3. TadA reprogramming to generate d12fCBEs with improved properties.
a Impact of quintuple mutations on C-to-T activity and preference. Bar graphs from left to right show ratios of C-to-T to A-to-G activity, relative C-to-T, and A-G efficiencies compared to 49-NL-8e, respectively. Editing signatures of 49-NL-8e variants were assessed at one representative endogenous site (sgRNA-1) in HEK293T cells. Two biologically independent screening experiments were performed, with FACS representing screening with flow-cytometry enrichment, and NO FACS representing screening without flow-cytometry enrichment. b Editing signatures of 49-NL-8e (GGATY). n = 3 biologically independent experiments. Adenine editing (A editing) was shown in red lines and cytosine editing (C editing) was shown in blue lines. c Number of cytosine-to-urine (C-to-U) RNA edits for classical CBEs AncBE4, N-A3A-BE and TadA-reprogrammed CBEs 49-NL-8e (28G46C), 49-NL-8e (GGATY). n = 3 or 4 (49-NL-8e) biologically independent experiments. d Cas9-independent off-target C-to-T conversion frequencies detected by R-loop assay at 6 R-loop sites with dSaCas9 and corresponding sgRNAs. Bars in the plots represent C positions showing the highest C-to-T activity at each R-loop site, with two C positions in R-loop 5 showing obvious C-to-T activity. n = 3 biologically independent experiments. e, f C-to-T editing signatures of TadA-reprogrammed d12fCBEs N-/CL-/DS128-/DS130-d12fCBE-8e (GGATY) (e) in orange, green, blue, and purple line, respectively; and N-/CL-/DS128-/DS130-dRRACBE-8e (GGATY) (f) in blue, red and orange line respectively, across 12 endogenous sites. n = 3 biologically independent experiments. g Number of C-to-U RNA edits for representative miniCBEs. n = 3 biologically independent experiments. h Total number of all SNVs relative to the parent sample detected by WGS. n = 3 biologically independent experiments. NC negative control. Data were presented as mean ± SEM. in histograms. Source data are provided as a Source Data file.

