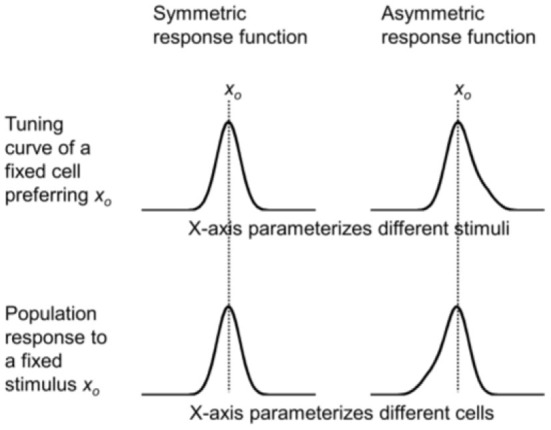
Figure 2.

Simulations of the mirror relationship between the tuning curve of a cell preferring xp = xo (top row) and the population response to a stimulus xs = xo (bottom row), under the assumption of translational invariance. The mirror relationship is hidden when a symmetric response function is used (left column), but is revealed with an asymmetric function (right column).
