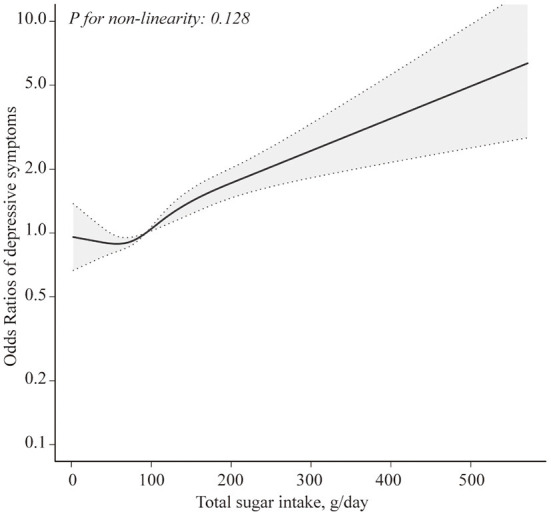
Figure 1.

Restricted cubic spline model of the odds ratios of total sugar intake with depressive symptoms. Adjusted for age, gender, BMI, total energy intake, physical activity, marital status, race, education level, household income, smoking status, drinking history, hypertension, and diabetes. The dashed lines represent the 95% confidence intervals.
