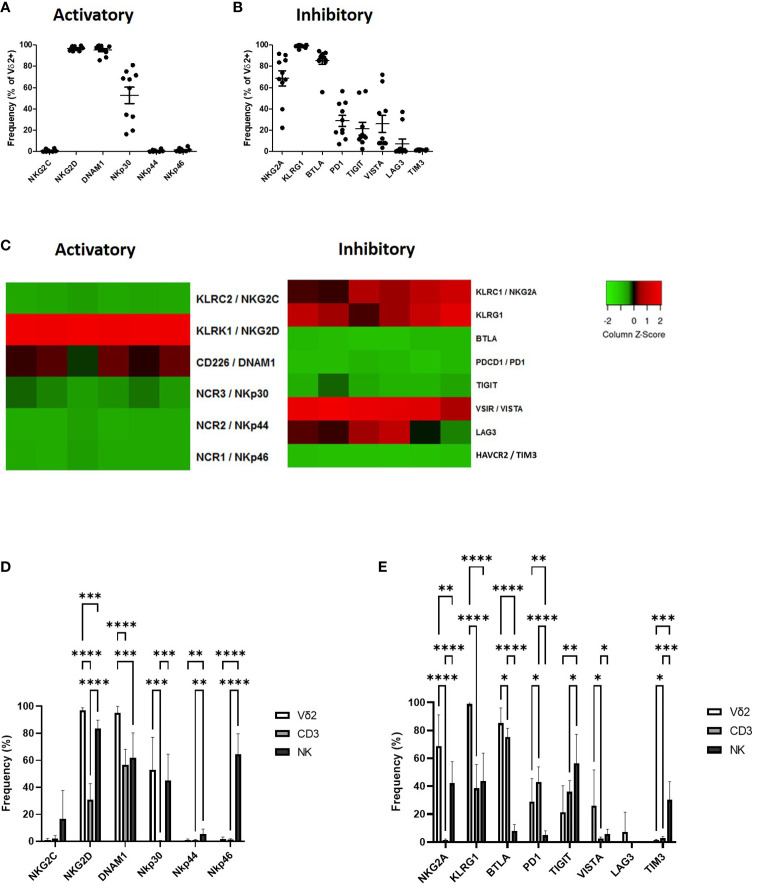
Figure 1.
Expression of NK associated activatory receptors (A) and inhibitory checkpoint receptors (B) was determined in Vγ9Vδ2+ cells in PBMCs from healthy donors using flow cytometry. Heat maps showing the expression of NK associated activatory and inhibitory receptors in Vγ9Vδ2+ cells from 6 donors using RNAseq (C). Expression of NK associated activatory receptors (D) and inhibitory checkpoint receptors (E) in Vγ9Vδ2+ cells was compared to CD3+ T-cells and CD56+ NK cells. N=10. *p<0.05, **p<0.005, ***p<0.0005, ****p<0.0001, non-parametric analysis of variance with Tukey’s post hoc for multiple pairwise comparisons.

