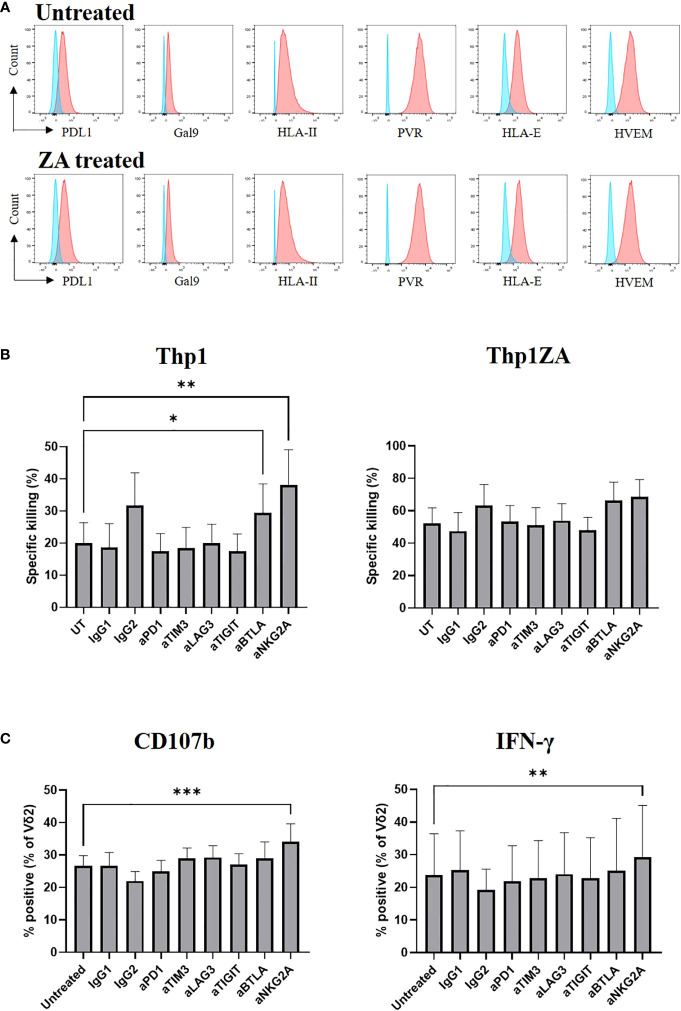
Figure 5.
Expression of checkpoint receptor ligands (red) was compared to control (blue) on Thp1 cells with and without 50μM ZA pre-treatment (A). ZA expanded Vδ2 cells were isolated and cultured with CTFR labelled Thp1 target cells, with or without 50μM ZA pre-treatment, at a 1:1 ratio in the presence or absence of 5μg anti-PD1, anti-TIM3, anti-LAG3,anti-TIGIT, anti-BTLA and anti-NKG2A. Specific killing of tumour cells was calculated following 16 hours (B) and production of CD107b and IFNγ by Vδ2 cells was assessed by ICS and flow cytometry following 4 hours (C). N=7. *<0.05, mixed effects analysis with Dunnett’s post hoc for multiple pairwise comparisons. **p<0.005, ***p<0.0005.

