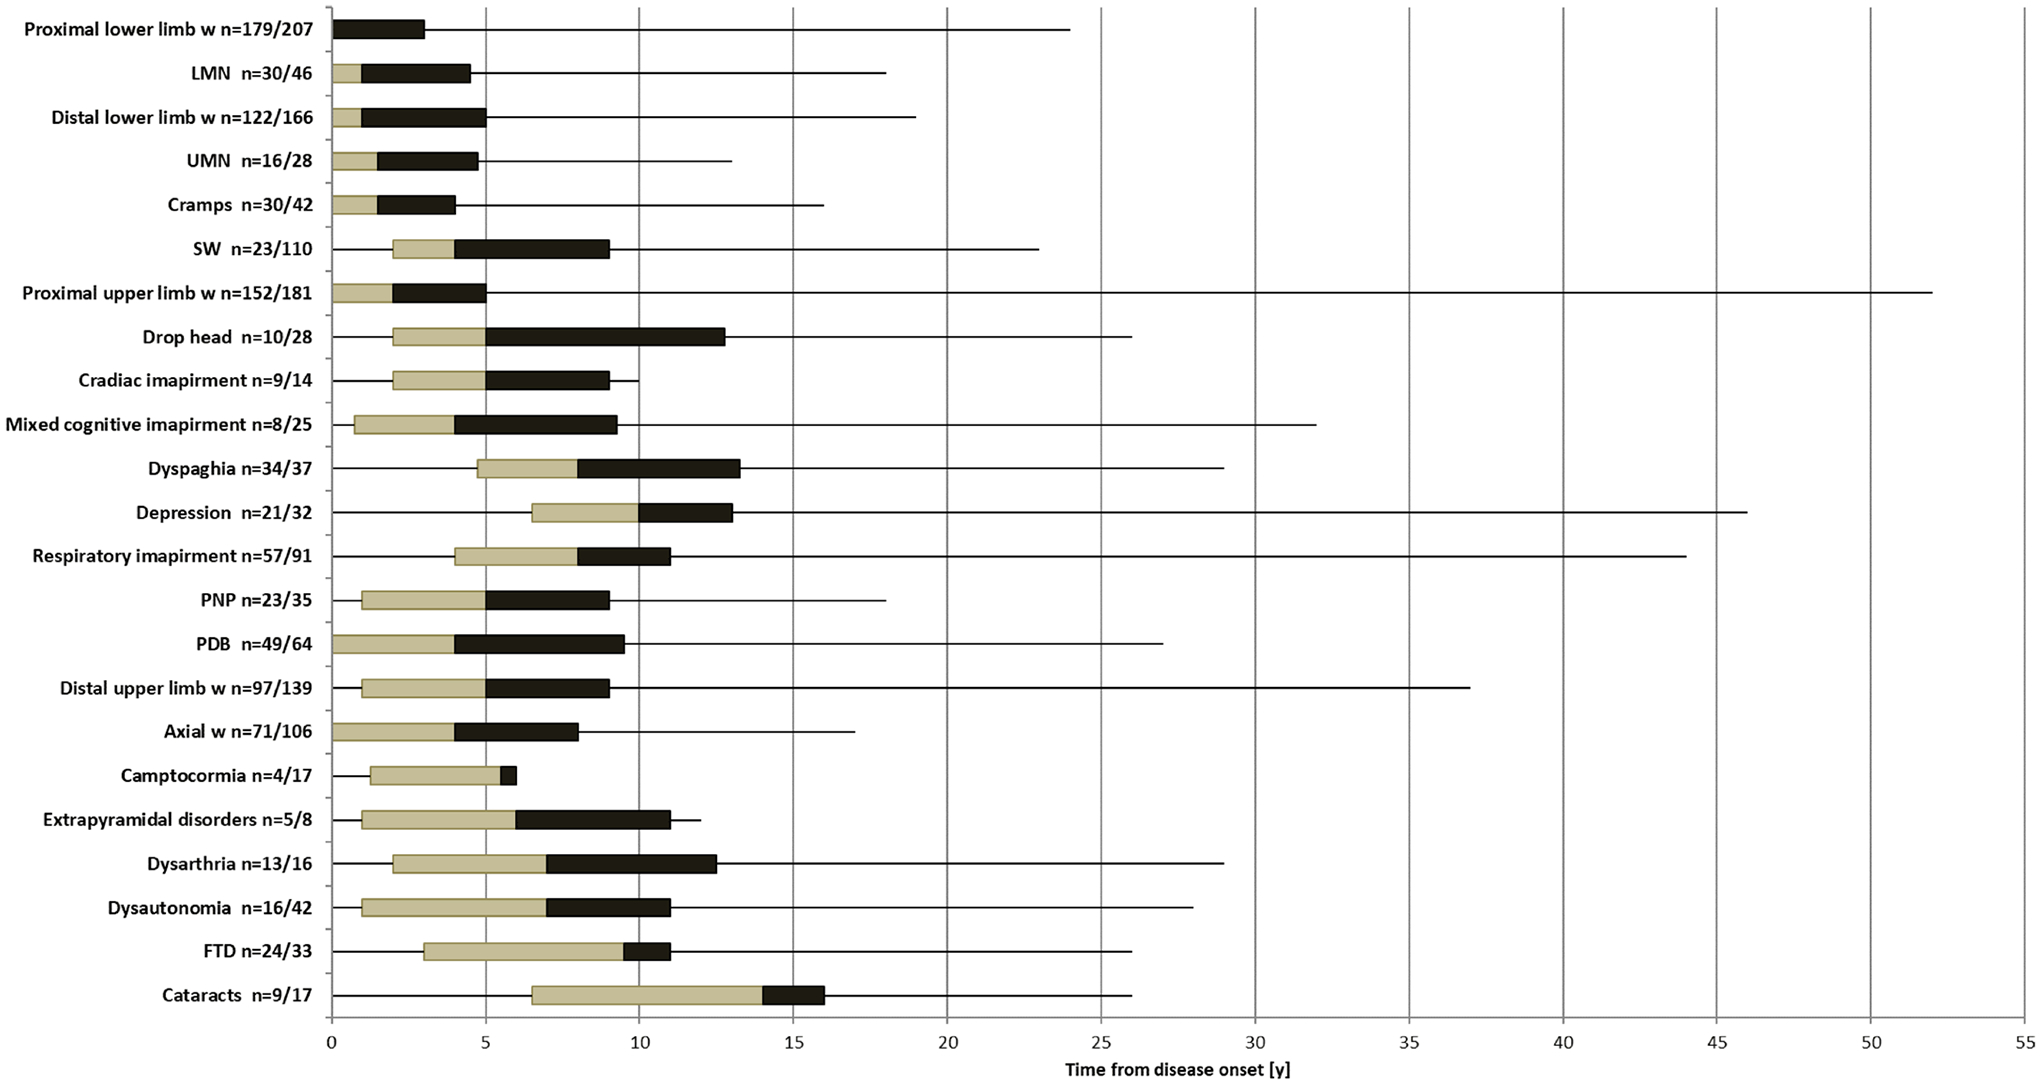
Figure 3.

Time of signs/symptoms development from disease onset (y). The box figures show the time of signs/symptoms development from disease onset in years. The limits of the box are the 25th and 75th percentile. The middle line within the boxes represents the median. The ends of the lines extending from the boxes represent the minimum and maximum values. n=number of patients in which data about the time from disease onset was available among those patients who reported the sign/ symptom at last assessment. FTD, frontotemporal dementia; LMN, lower motor neuron signs; PDB, Paget’s disease of the bone; PNP, polyneuropathy; UMN, upper motor neuron; W, weakness.
