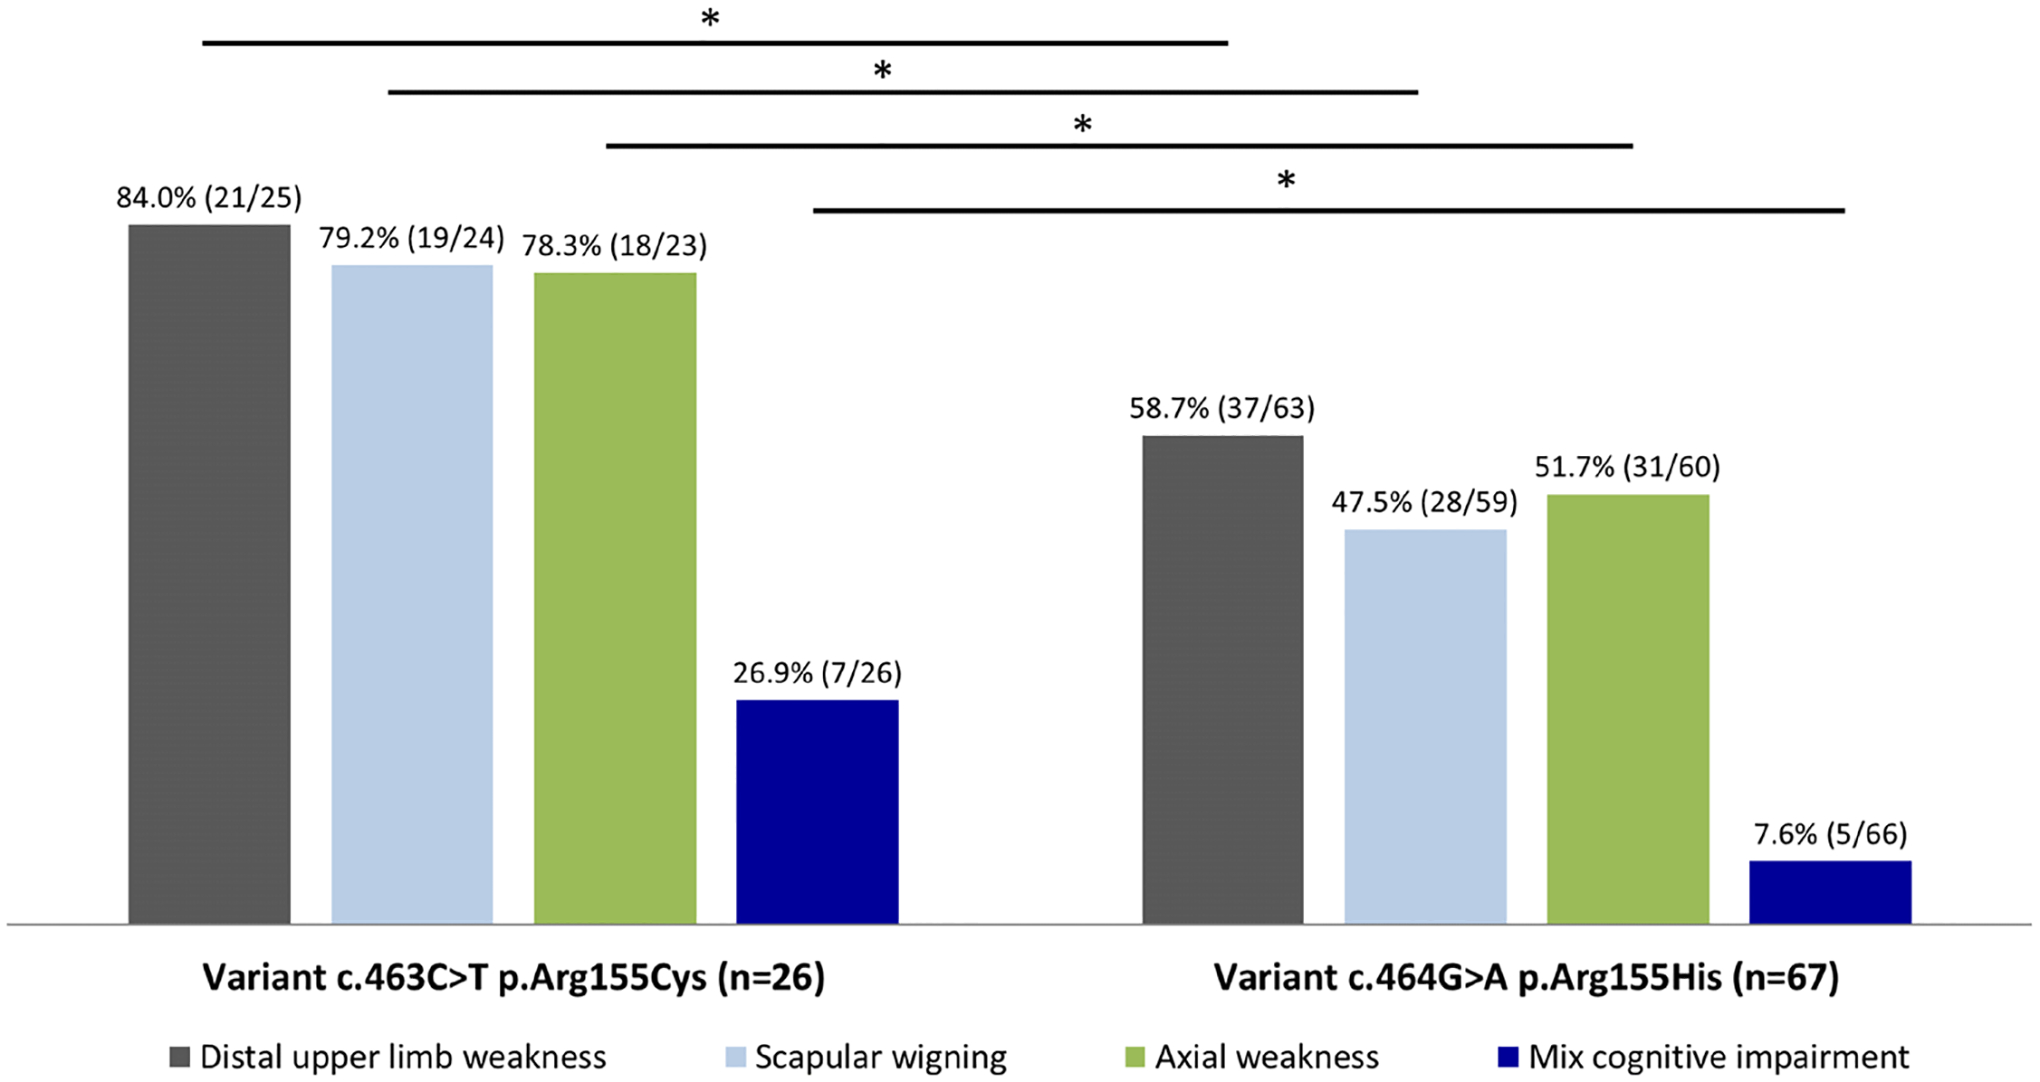
Figure 4.

Frequency of signs/symptoms between the two most frequent variants. The bar graph shows the percentage of signs/symptoms in which significant differences were found between the two most frequent variants identified in this study. Numbers in brackets above the bars represent: the numerator the frequency of patients in whom the sign/symptom was present and the denominator the number of patients in which the data was available by variant. *P<0.05, χ2 test.
