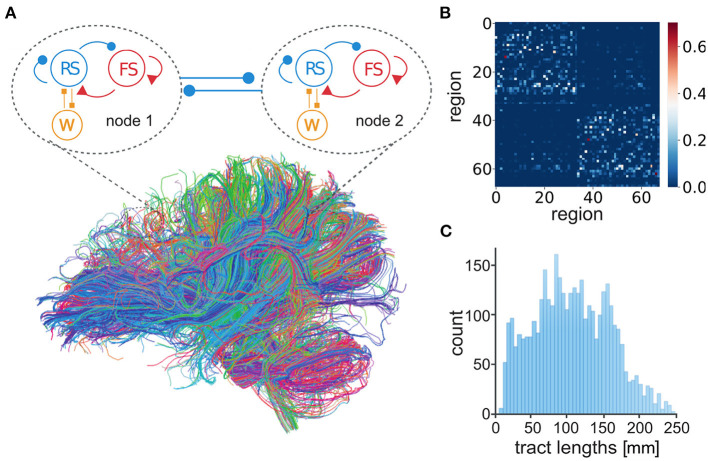
Figure 2.
Connection of AdEx mean-field models in The Virtual Brain. (A) Each mean-field model consists of two populations, excitatory RS (blue) and inhibitory FS (red) neurons (as in Figure 1H), taking into account spike-frequency adaptation for excitatory neurons (W, orange). Mean-field models represent the mesoscopic scale, here comprising each of 68 defined regions of cerebral cortex. Brain regions are connected by excitatory tracts (thick blue lines) following structural connectomes (Schirner et al., 2015). (B) Number of fibers connecting brain regions in tractography data, divided by the sum of the gray matter volume of regions in anatomical MRI, is used to define connectivity weights between nodes. (C) The distribution of tract lengths in tractography data informs delays between TVB-AdEx model nodes.

