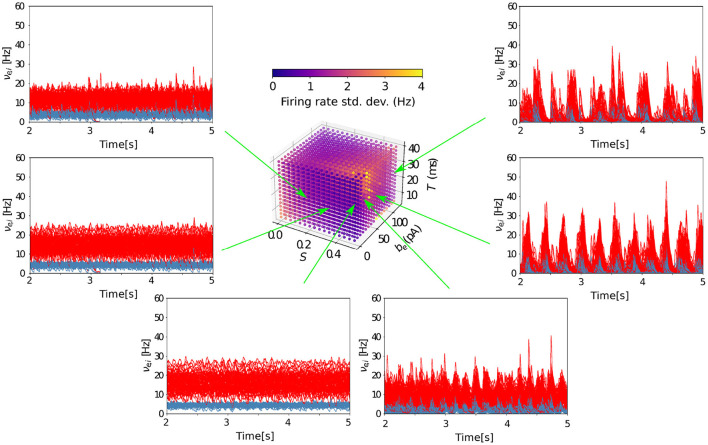
Figure 6.
Grid search in parameter space for asynchronous and slow oscillatory states. The TVB-AdEx model was run for six different parameter combinations in the depolarized region (EL,i = EL,e = −64 mV) and the time traces of the inhibitory and excitatory populations of the 68 AdEx mean-field models are plotted during the last 3 s of the simulation. With be = 0 pA, for intermediate values of S, one can see how AI states appear, consistent with the low value of SD shown in the feature plot. For S = 0.5, one can see the transition between AI and UD states when increasing be.

