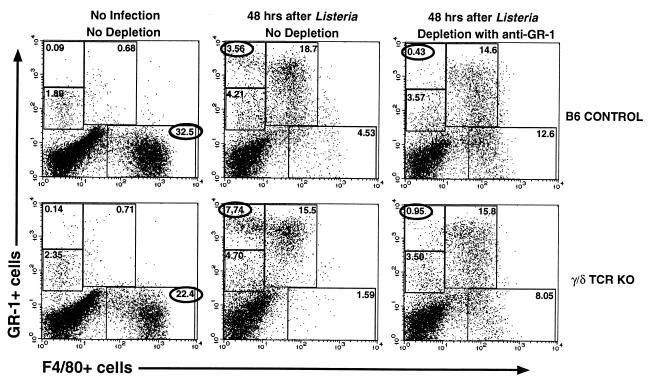
FIG. 4.
Myeloid cell populations in the peritoneal cavity in γ/δ TCR KO mice differ both before and after infection with Listeria. Cells were stained with F4/80-FITC to identify mature macrophages and GR-1–PE as a marker for mature granulocytes and examined by flow cytometry. Myeloid populations were analyzed in uninjected mice or 48 h after infection with 1.4 × 10⁴ CFU of Listeria or 48 h after Listeria infection and depletion of granulocytes (F4/80− GR-1+ cells). To deplete granulocytes, 150 μg of purified anti-GR-1 (RB6-8C5) antibody was injected i.p. 24 h before and after Listeria infection and with the Listeria injection itself. Data are percentages of the entire peritoneal cell population included within the defined regions of the dot plots. Since the numbers of cells per mouse for control and KO mice did not differ, these percentages represent differences in cellularity between the two strains.

