
FIGURE 2.
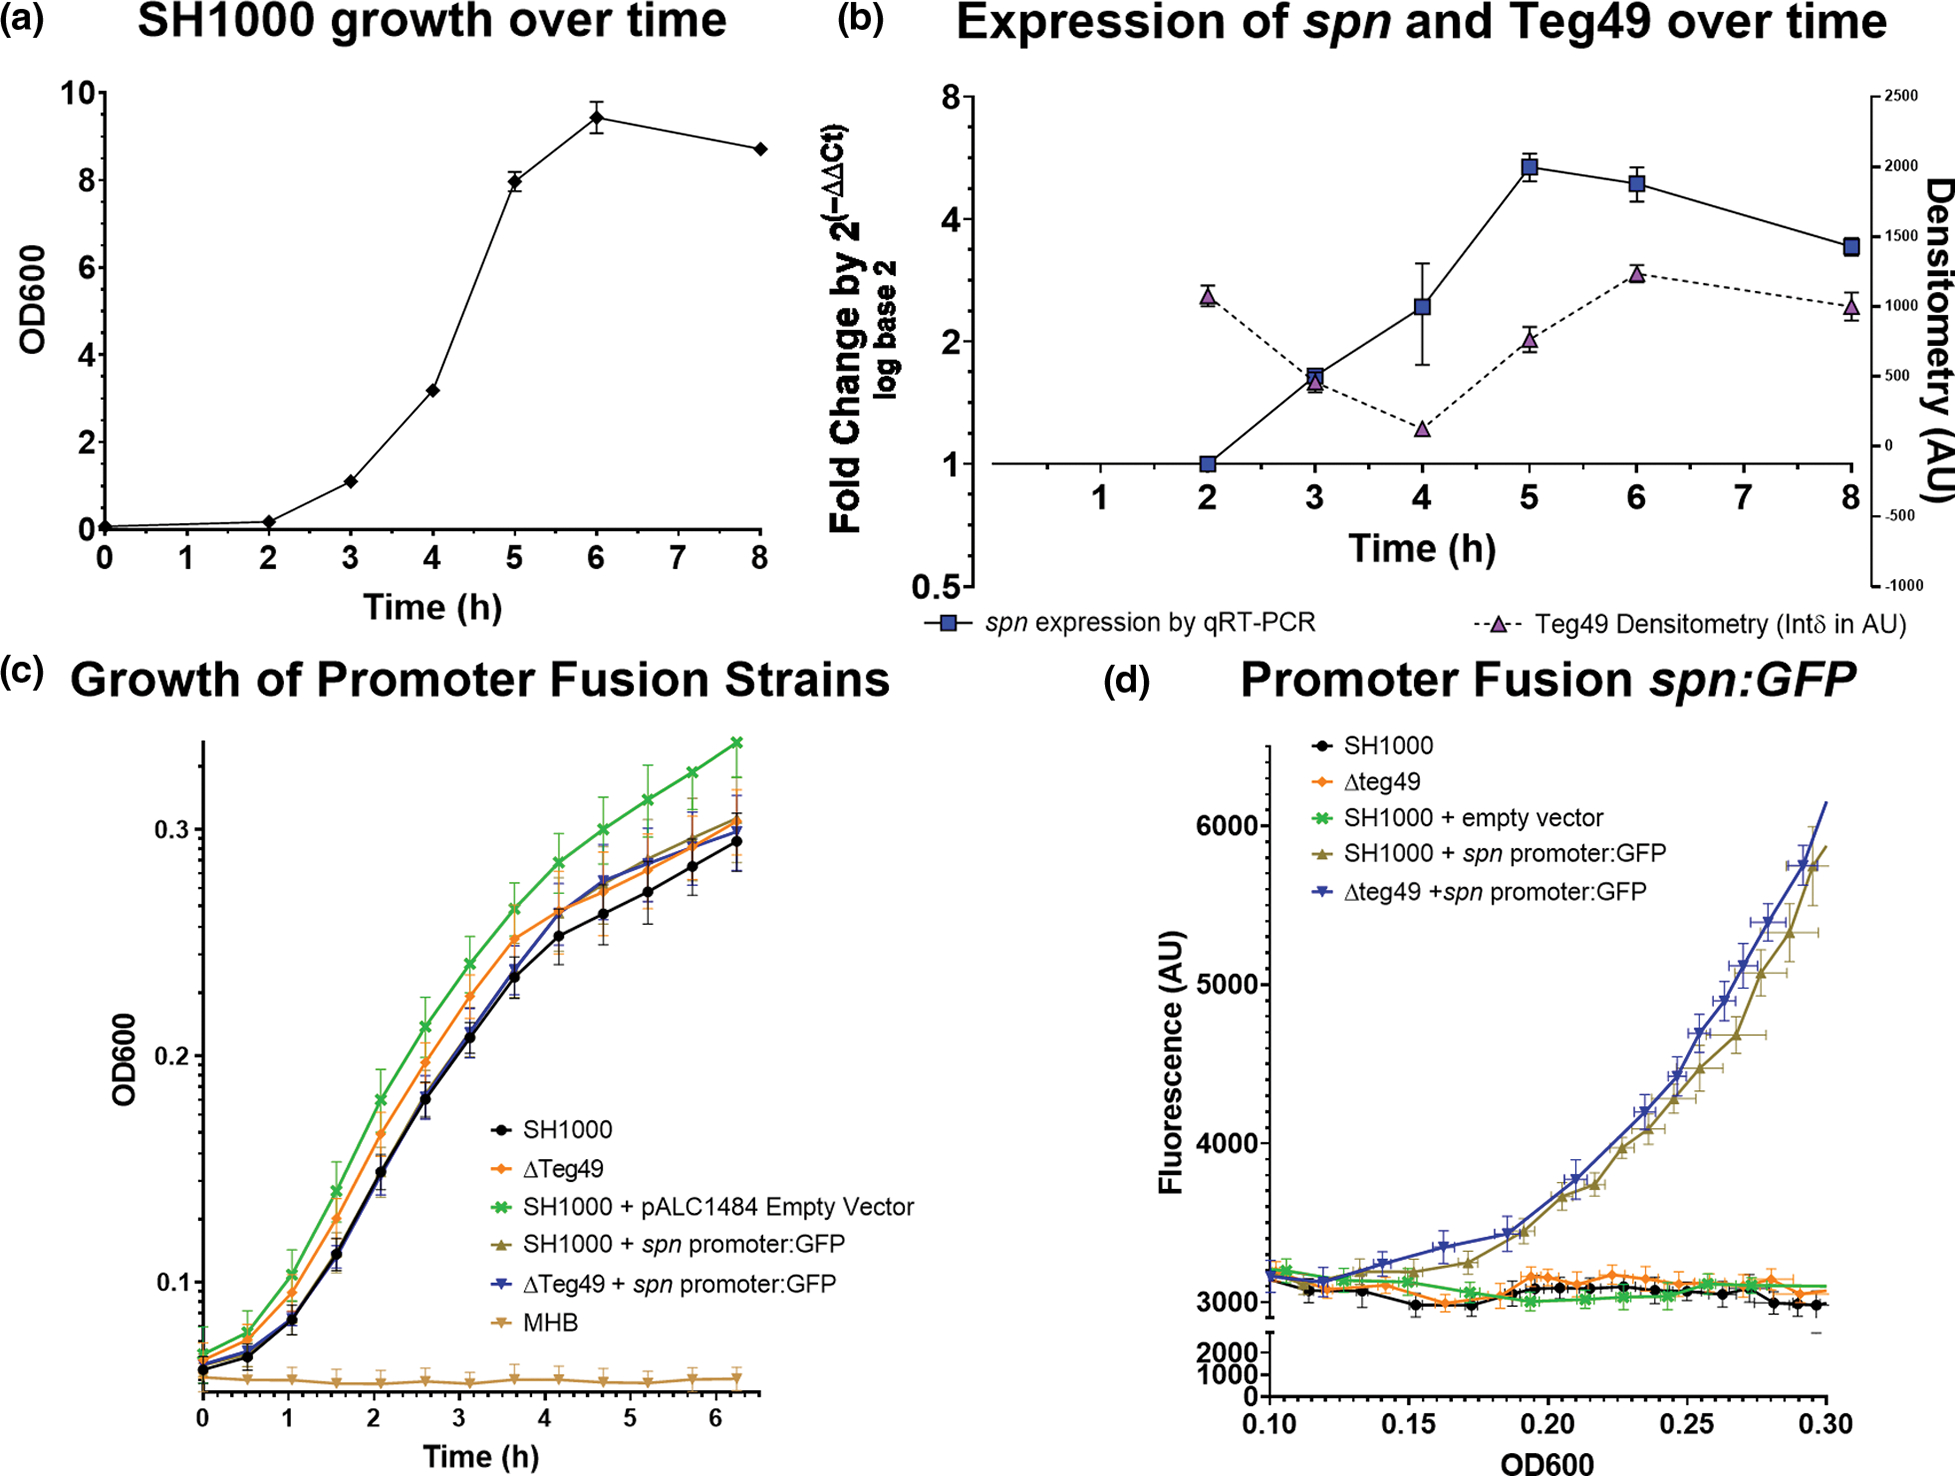
Characterization of spn expression during growth. (a) Growth of strain SH1000 as determined by OD600 in a spectrophotometer with a 1 cm cuvette. (b) The left Y-axis represents a time-course of spn expression by qRT-PCR at OD corresponding to growth in (a). Increasing levels of the spn transcript were detected as cells reached the stationary phase and then tapered. The Y axis on the right is a densitometric analysis of a northern blot of Teg49 during 8 h. growth after dilution from an overnight culture. The timepoints for the densitometry are approximate but are not identical to those in (a). (c) OD600 growth curve for wild type SH100 and ΔTeg49 with or without the pALC1484:Spn promoter GFP fusion plasmid and the control empty vector in SH1000. (d) Fluorescence of the same strains (as in (c)) was measured in AU over OD600. OD600 was measured using a Tecan infinity 1000 with a 100 μl volume in a standard 96 well plate and reached a plateau at OD600 = 0.29/0.30. There was no significant difference in fluorescence between the SH1000 and ΔTeg49 strain containing the spn promoter fusion plasmid.