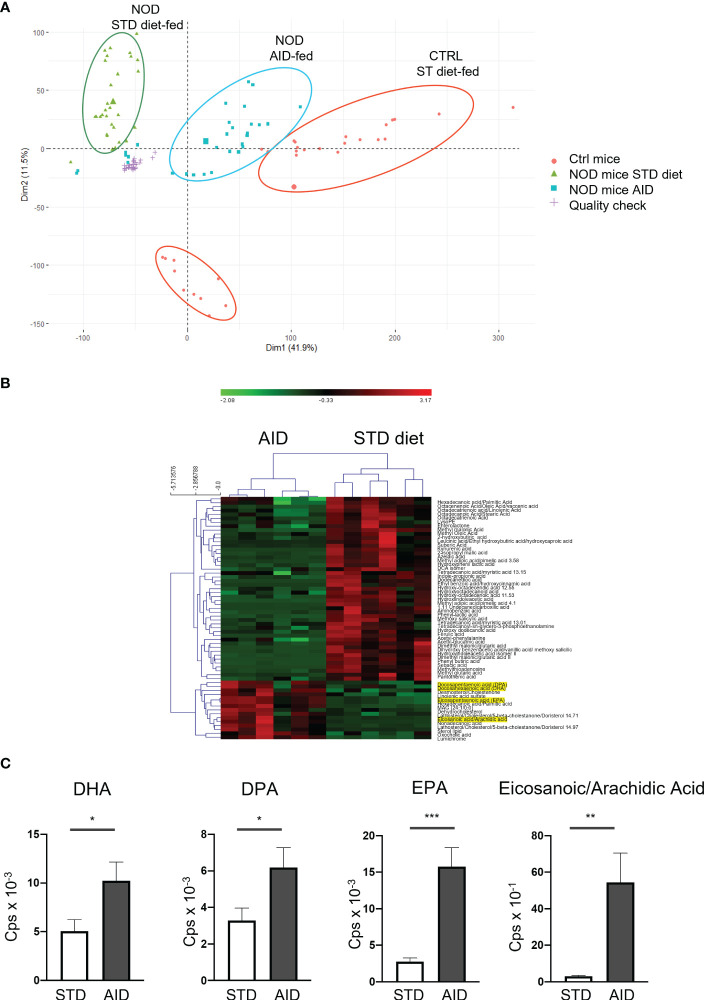
Figure 6.
Metabolomic profiles of stools from AID or STD diet-fed NOD mice. (A) Representative PCA analysis of 17630 features in positive polarity with FDR p-value < 0.05 in STD-diet and AID-fed NOD mice and non-autoimmune Balb/c mice (n=6 per group). Technical replicates for the QC sample clustered together, showing a very reproducible LC-MS/MS analysis. The larger symbol per group indicates the mean of all the samples. (B) Heatmap of the peak areas for the 62 annotated metabolites which were significantly different between STD-fed vs AID-fed NOD mice. The overrepresented metabolites are in red, while the underrepresented ones are indicated in green. 15 out of 62 metabolites were upregulated in the group of AID-fed NOD mice. (C) Selected differentially represented metabolites in AID vs STD-fed NOD mice. Data are expressed as mean percentages ± SEM. *p < 0.05; **p < 0.01; ***p < 0.001.

