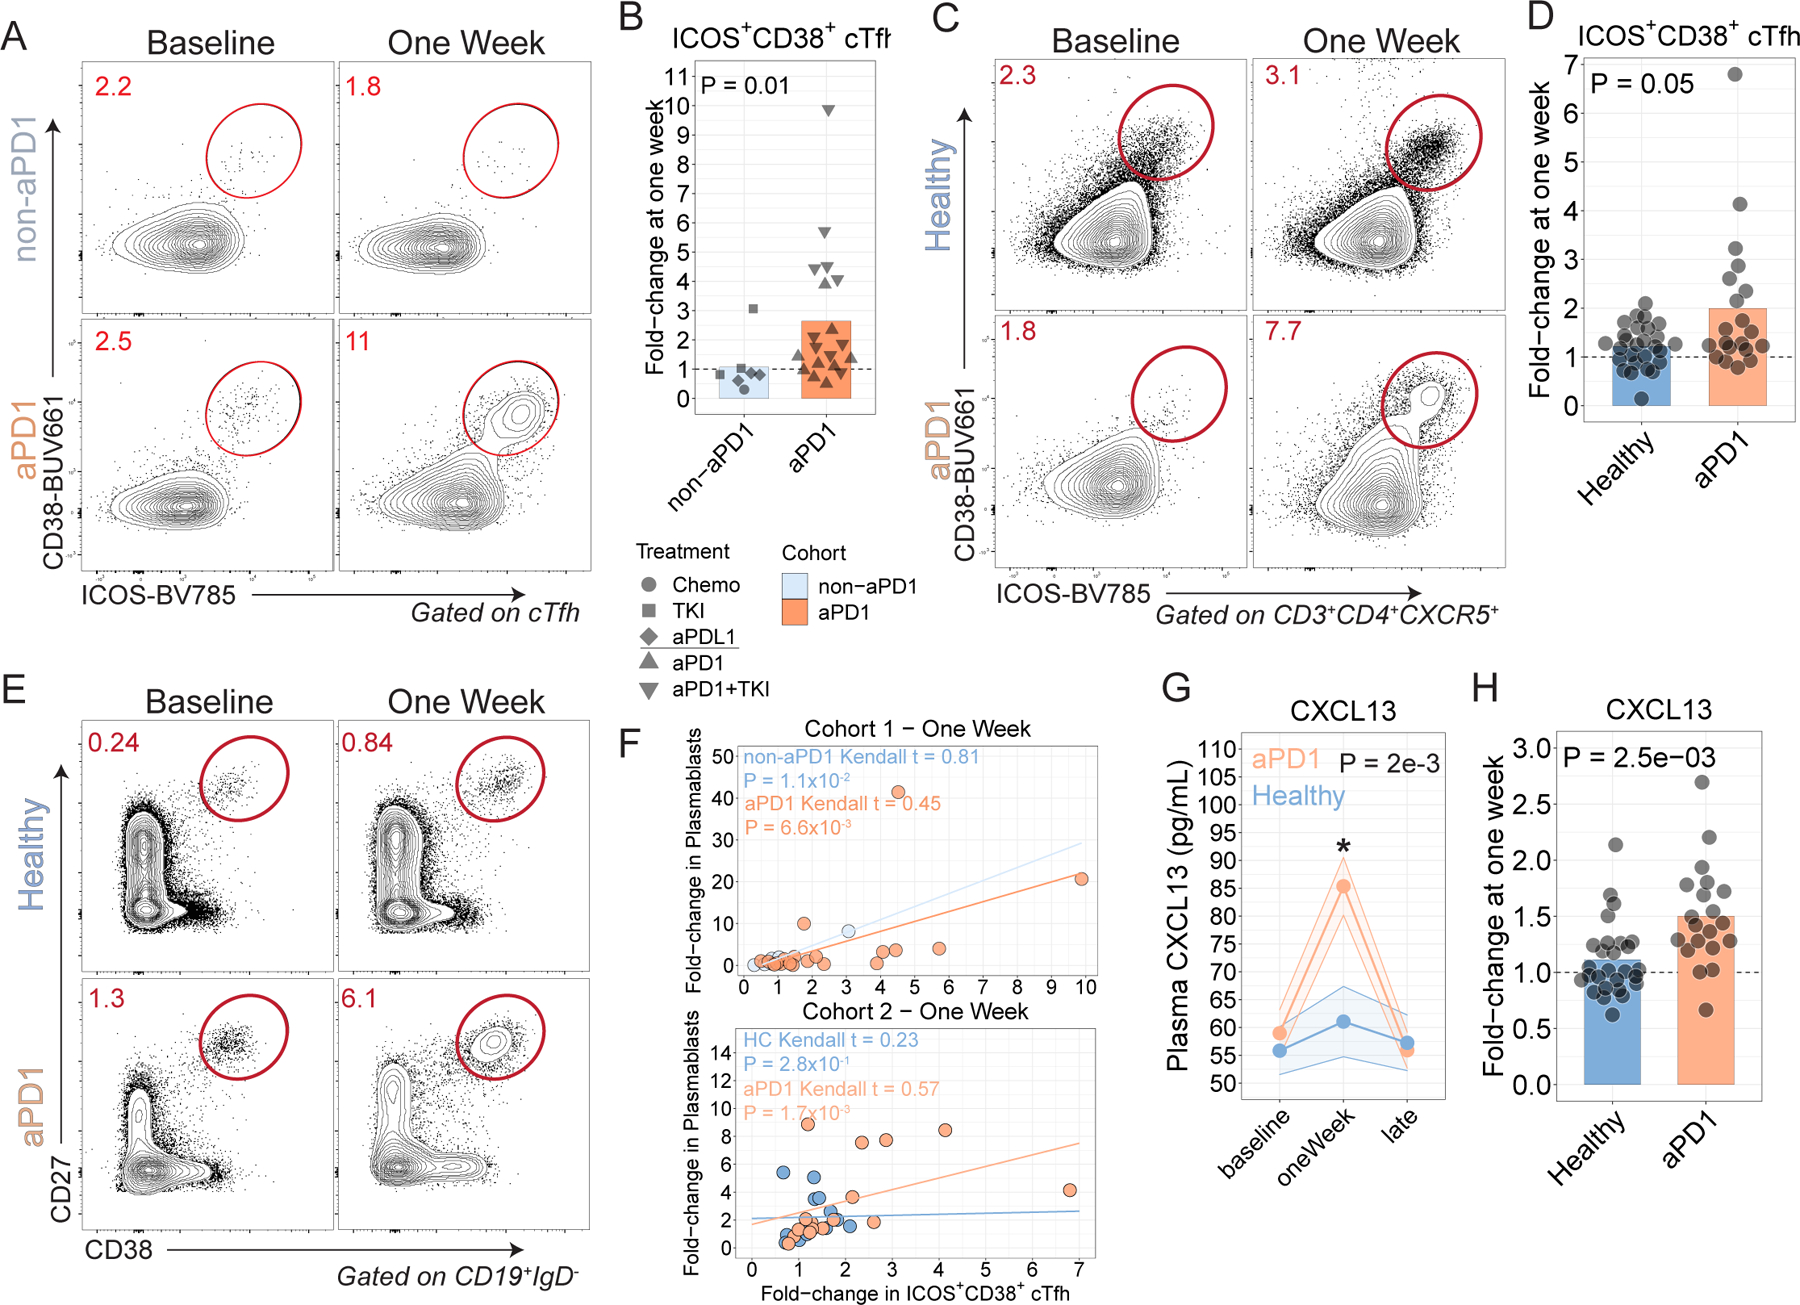
Figure 1. aPD1 treatment is associated with enhanced cTfh, B cell and GC responses following influenza vaccination.

A. cTfh were profiled for expression of ICOS and CD38 at baseline and at one week after influenza vaccine in Cohort 1. B. ICOS+CD38+ cTfh fold-change at one week in Cohort 1 (P=0.01; Wilcoxon test). C. Patients with melanoma were recruited in Cohort 2 and profiled following influenza vaccination. cTfh responses shown at baseline and one week. D. ICOS+CD38+ cTfh fold-change at one week compared to baseline in Cohort 2 (P=0.05; Wilcoxon test). E. Plasmablast responses after influenza vaccination in Cohort 2. F. Correlation between Plasmablasts and ICOS+CD38+ cTfh at one week for Cohorts 1 and 2. G. Plasma CXCL13 over time (P=2x10⁻³ for aPD1 oneWeek compared to baseline; two-way ANOVA with Tukey’s post-test). H. Plasma CXCL13 fold-change at one week in Cohort 2 (P=2.5x10⁻³; two-sample t-test).
