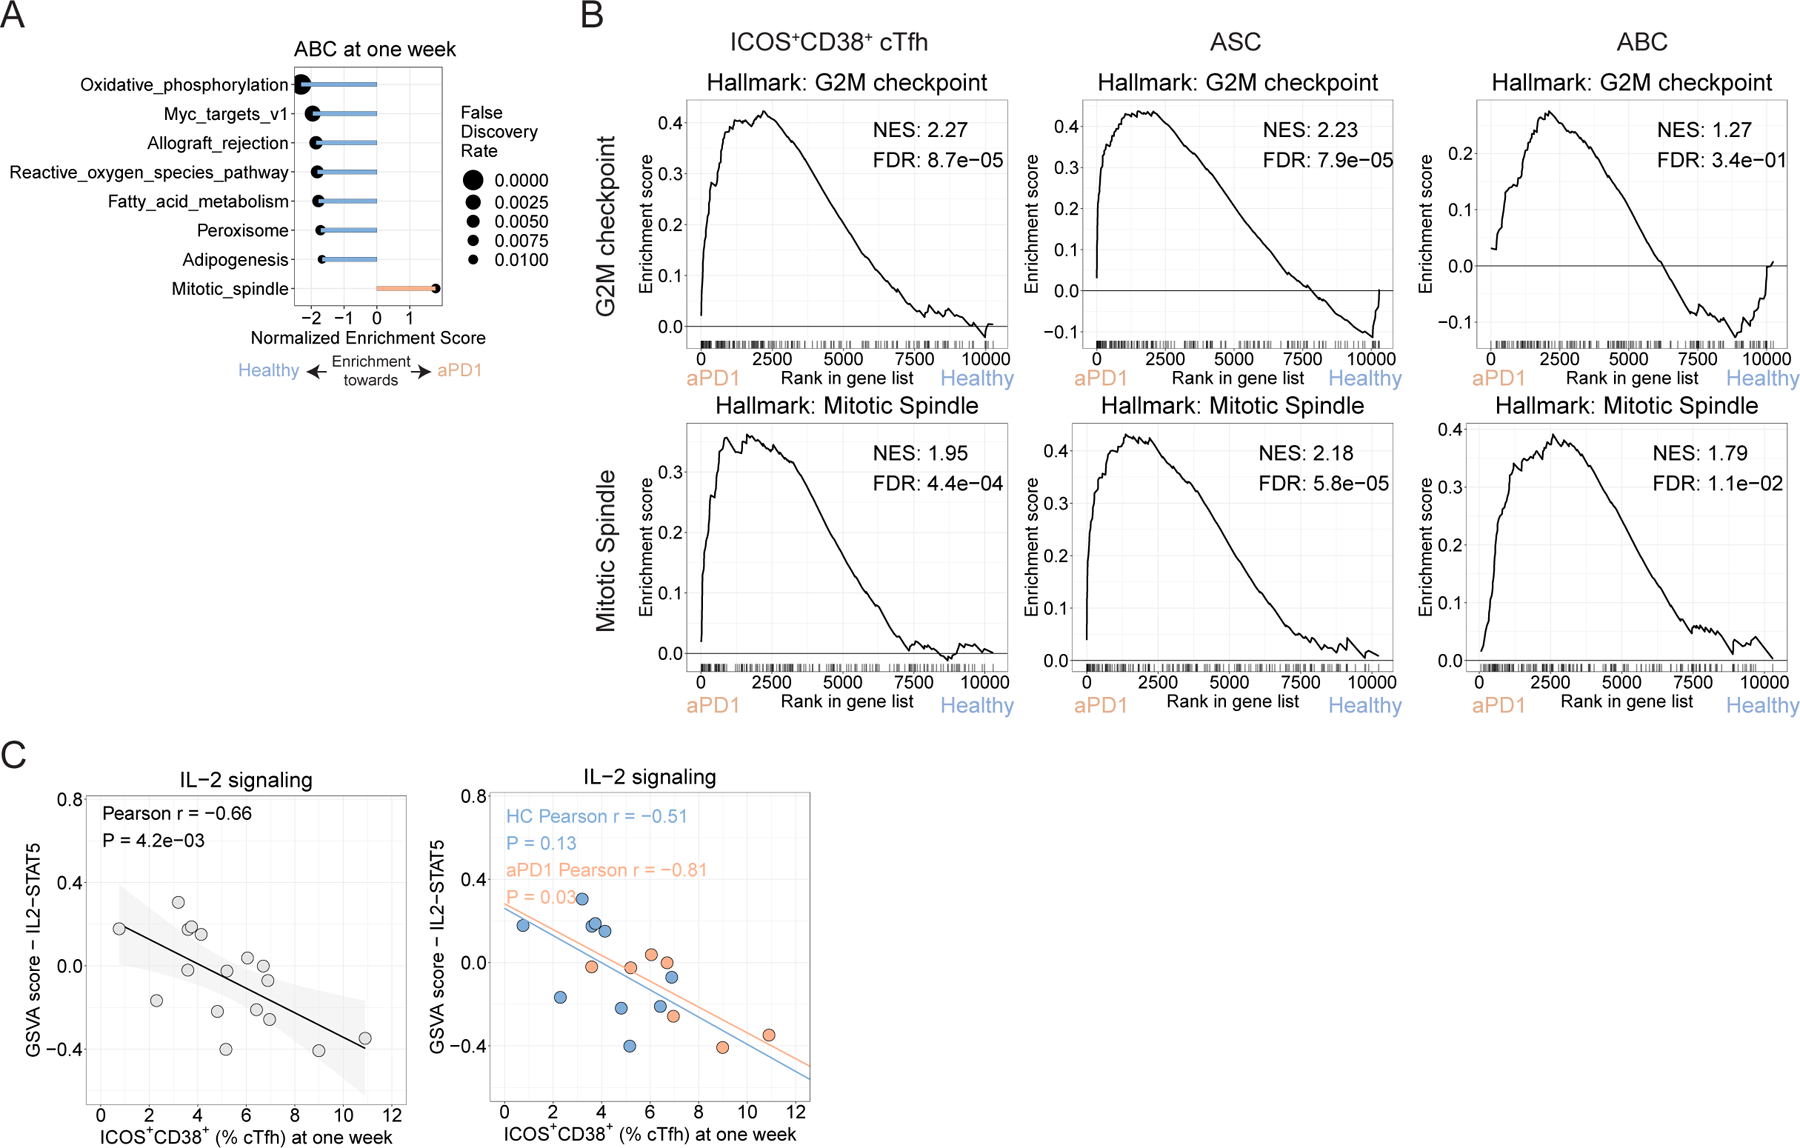
Extended Data Figure 6.

A. GSEA for Hallmark gene sets for ABC for FDR <0.05. B. GSEA plots for the G2M checkpoints and Mitotic Spindle gene sets. C. Pearson correlation for ICOS+CD38+ cTfh frequency at one week versus the GSVA score for the IL2/STAT5 gene set for ICOS+CD38+ cTfh at one week for the full study (left) and split by treatment group (right).
