
Extended Data Figure 7.
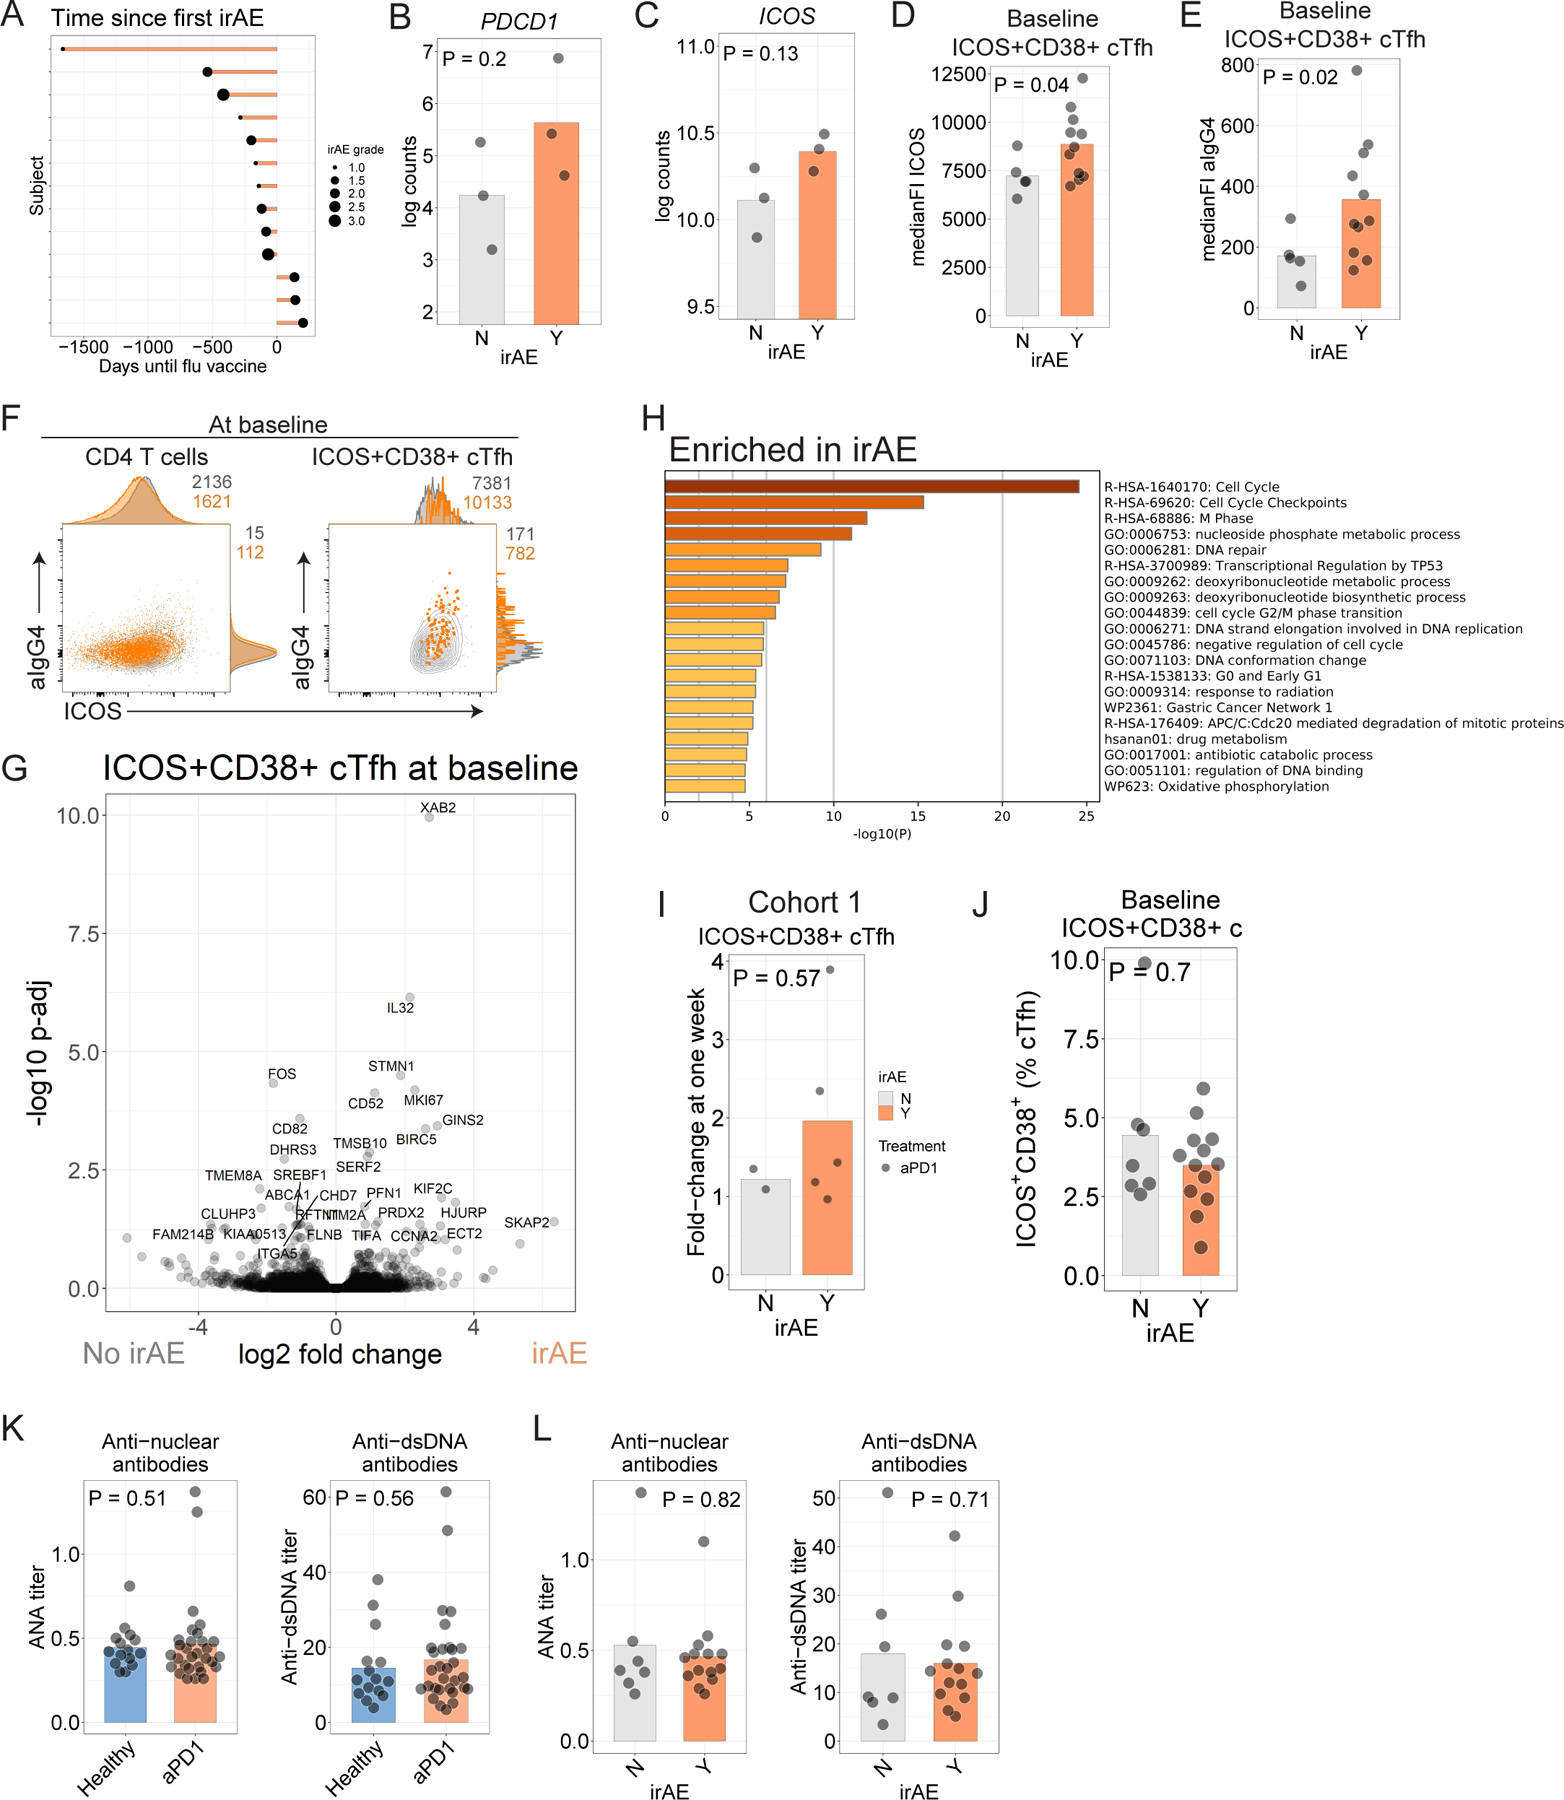
A. Time to development of irAE in Cohort 2. B-C. Log-transformed counts for PDCD1 (B) and ICOS (C). P values from t-test comparison. D. ICOS protein in ICOS+CD38+ cTfh before influenza vaccination in Cohort 2. E. αIgG4 staining in ICOS+CD38+ cTfh before influenza vaccination in Cohort 2. F. αIgG4 and ICOS protein in total CD4 (left) or ICOS+CD38+ cTfh (right) for participants who had irAE (orange) versus those who did not have irAE (grey). G. Volcano plot of genes differentially expressed in aPD1 cohort with respect to irAE. Genes labeled where Padj < 0.05. H. Gene ontology for genes differentially expressed at nominal P<0.05 for ICOS+CD38+ cTfh at baseline in participants in Cohort 2 who developed irAE. I. Fold-change in ICOS+CD38+ cTfh at one week compared to pre-vaccination baseline in Cohort 1. J. Baseline ICOS+CD38+ cTfh frequency among who developed irAE in Cohort 2. K. Plasma levels of antinuclear antibodies (ANA, left) and anti-dsDNA antibodies (right) were assessed at baseline in Cohort 2. L. Plasma ANA and anti-dsDNA antibodies compared among aPD1 participants split by irAE status.