
Figure 2. aPD1 is associated with quantitatively similar but qualitatively worse anti-HA antibodies.
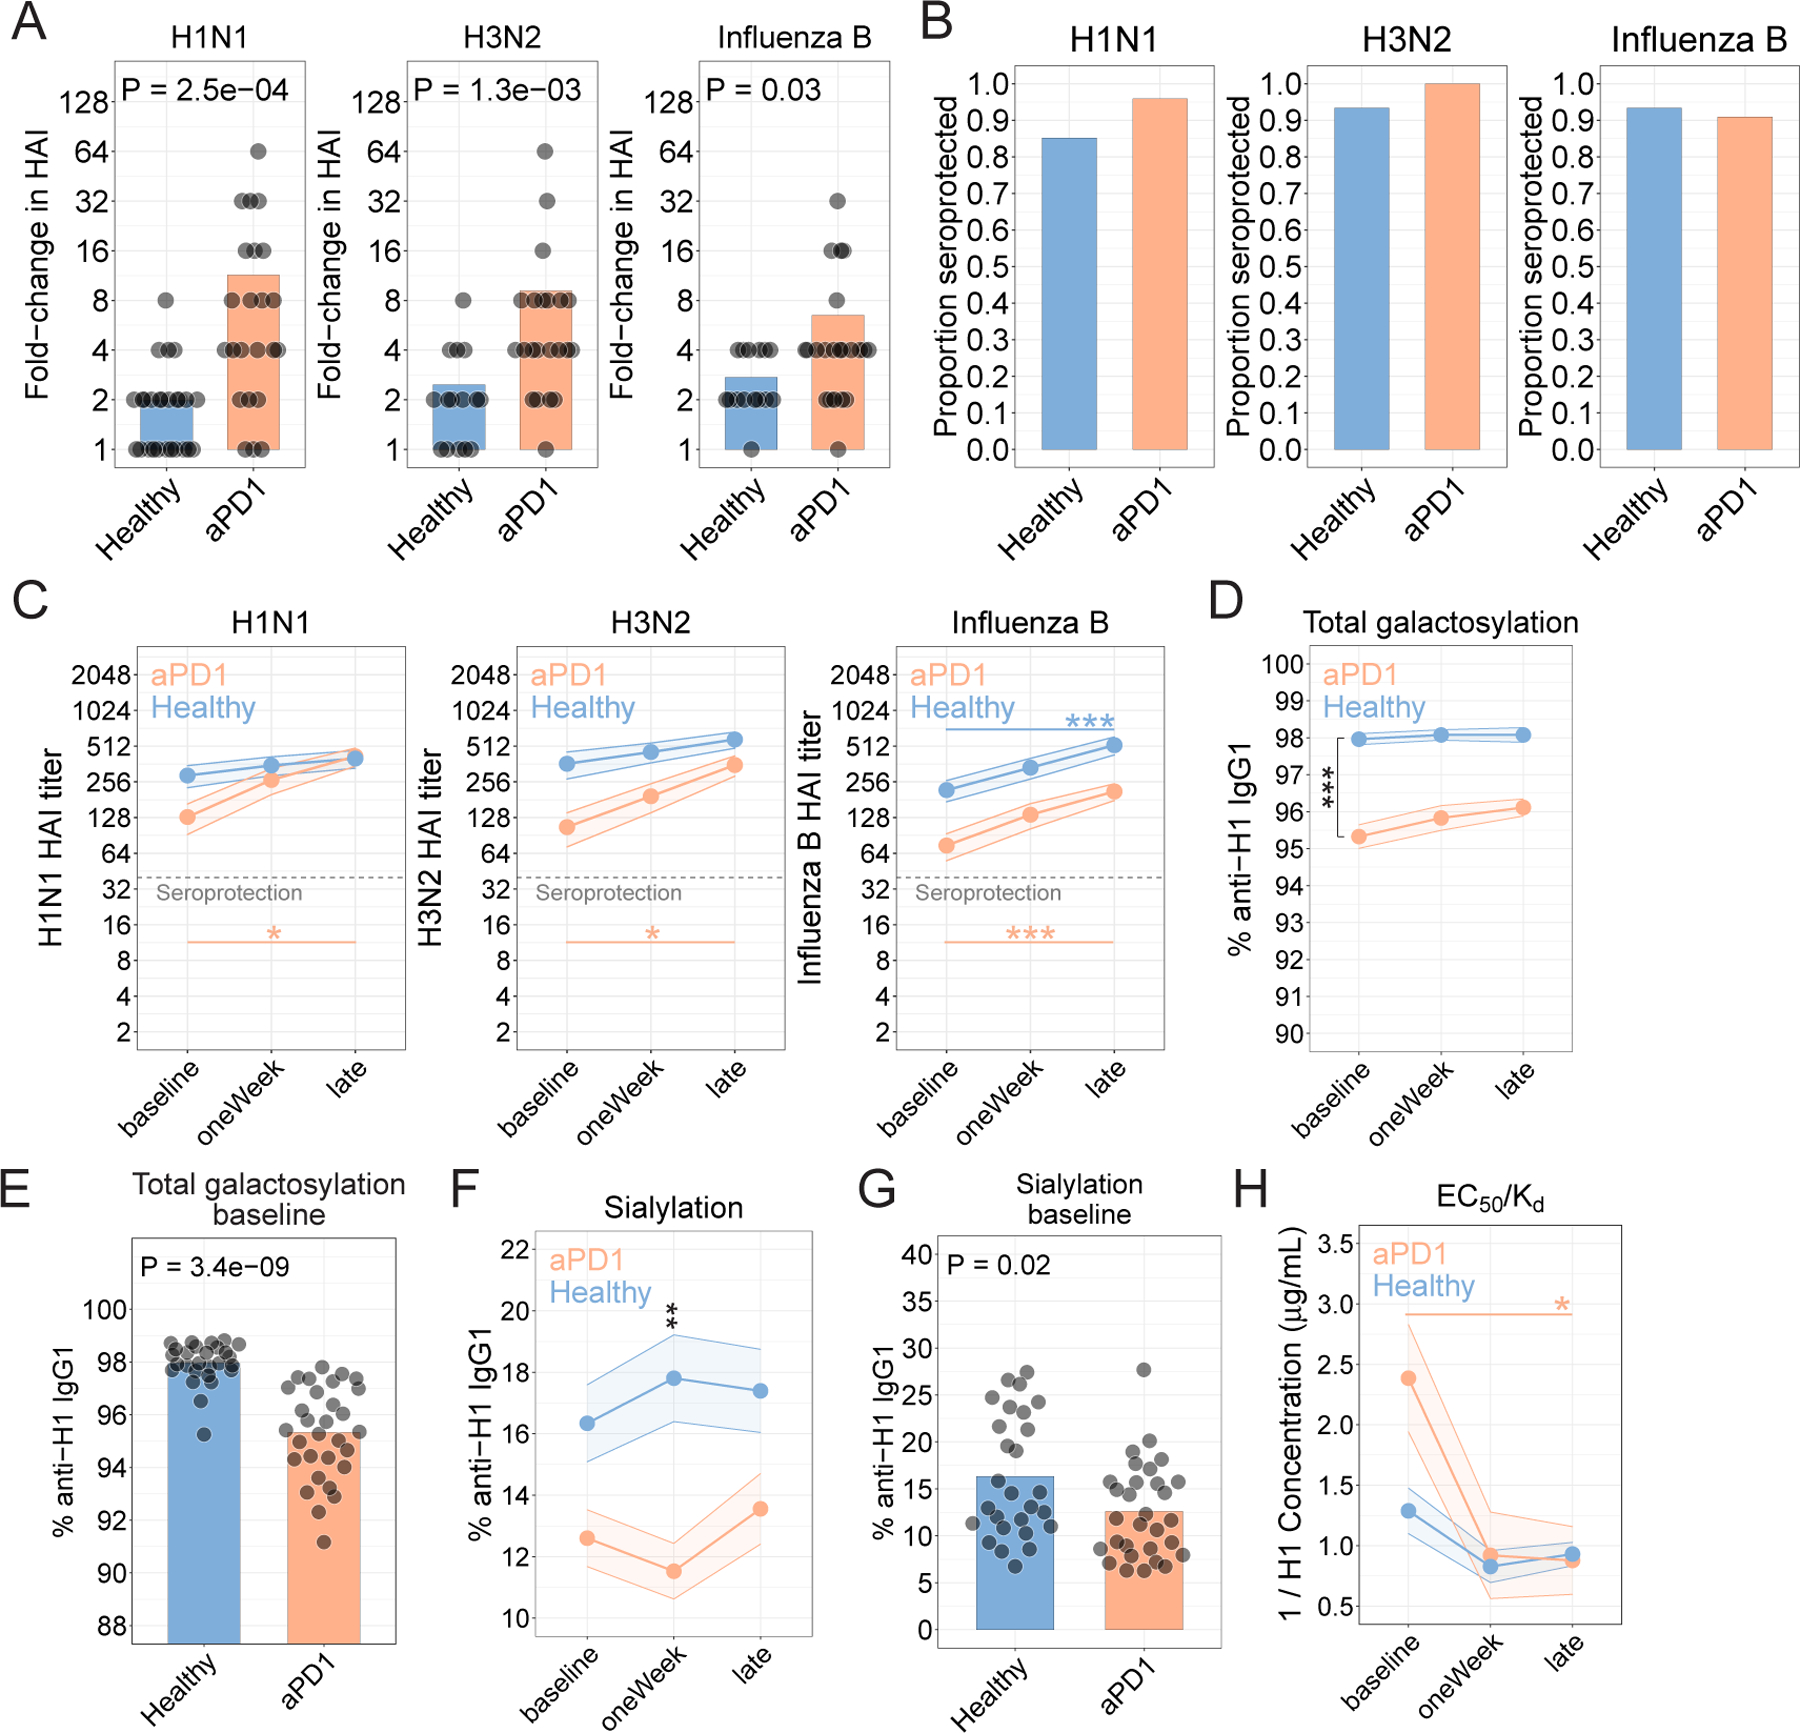
A. HAI as fold-change at the late time point compared to baseline for each strain. Nominal P values from t-test comparisons are shown. B. Seroprotection for each strain, shown as the proportion of participants who achieved an HAI titer of 1:40 or higher 21–42 days after vaccination. C. Hemagglutinin inhibition titers determined for the H1N1, H3N2, and influenza B strains. (*P<0.05, **P<0.01, ***P<0.001; two-way ANOVA with Tukey’s). D. Proportion of anti-H1 IgG1 antibodies galactosylated (***P=1.8x10⁻¹²; two-way ANOVA with Tukey’s; comparison of aPD1 vs Healthy at baseline). E. Proportion anti-H1 antibodies galactosylated at baseline (P=3.4x10⁻⁹; t-test). F. Sialylation for anti-H1 IgG1 antibodies (**P=7.1x10⁻³; two-way ANOVA with Tukey’s; comparison of aPD1 vs Healthy at oneWeek). G. Proportion anti-H1 antibodies sialylated at baseline (P=0.02; t-test). H. Affinity determined as EC50/Kd (*P=0.02; two-way ANOVA with Tukey’s; comparison of aPD1 at baseline vs late).