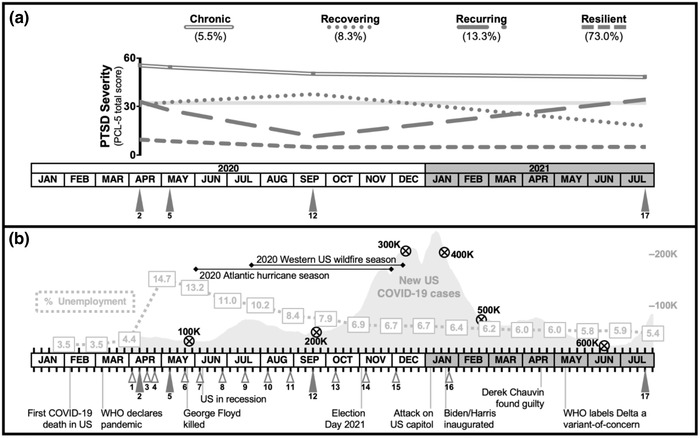
FIGURE 1.

Longitudinal posttraumatic stress disorder (PTSD) trajectories from the (a) four‐trajectory model alongside a (b) timeline of U.S. unemployment rates, sociopolitical events, and COVID‐19 cases and related deaths, from January 2020 to July 2021
Note: In Panel A, the gray area between PTSD Checklist for DSM‐5 (PCL‐5) total scores of 31–33 represents the range of diagnostic thresholds that have been found in psychometric evaluations of the PCL‐5 (Morrison, et al., 2021; Bovin et al., 2016; Wortmann et al., 2016; Hoge et al., 2014). Timepoints 2, 5, 12, and 17 represent the four PTSD assessment periods.
