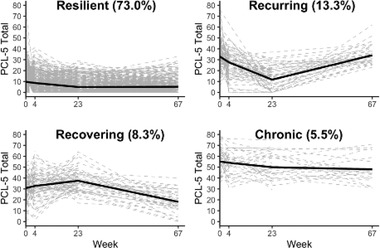
FIGURE 2.

Estimated model trajectories and individual observed posttraumatic stress disorder (PTSD) trajectories
Note: Black solid lines represent the mean trajectory based on the estimated intercepts and slopes from the latent growth mixture modeling. Gray dashed lines represent individual participant trajectories based on data collected at 0, 4, 23, and 67 weeks, indicated on the x‐axis. PCL‐5 = PTSD Checklist for DSM‐5.
