
Figure 1.
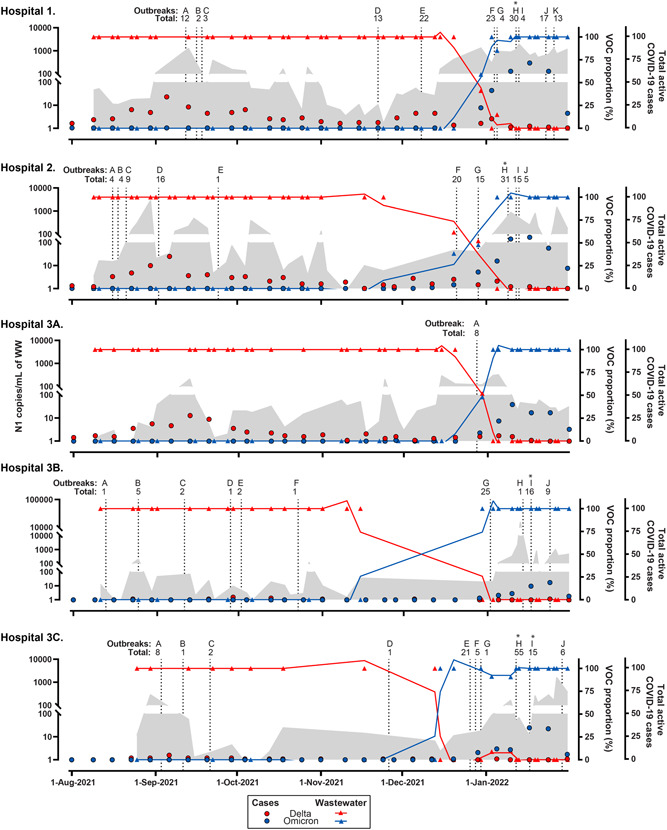
Daily census of COVID‐19 hospitalized individuals and SARS‐CoV‐2 RNA in hospital wastewater as a function of each variant of concern (VOC). Absolute concentration of SARS‐CoV‐2 RNA N1 signal (grey area), and the VOC proportion (%) of Delta (R203M mutation, red triangles) or Omicron (R203K/G204R mutation, blue triangles) in wastewater samples from five hospital locations: Hospital‐1, Hospital‐2, Hospital 3A, Hospital 3B; and Hospital 3C. The continuous blue and brown lines drawn through the triangle points are the lines of best fit plotted with the second order smoothing of the proportion of each mutation using GraphPad PRISM. N1 signal is presented in the left y‐axis and both VOC proportion (%) and smooth lines are presented in the first right y‐axis. Red and blue circles denote the weekly mean total number of prevalent cases for each VOC in the hospitals which is presented by the second right y‐axis. Vertical dash lines correspond to days where outbreaks were declared including the total number of individuals (i.e., patients plus health care workers) involved in each outbreak (Table 1). Asterisk denotes that for a specific outbreak more than one unit was involved. Please note that the N1 left Y‐axis scale is different for Hospital 3A. Since data in the left y‐axis is presented on a logarithmic 10 axis, it is not possible to plot nondetermined values (0)