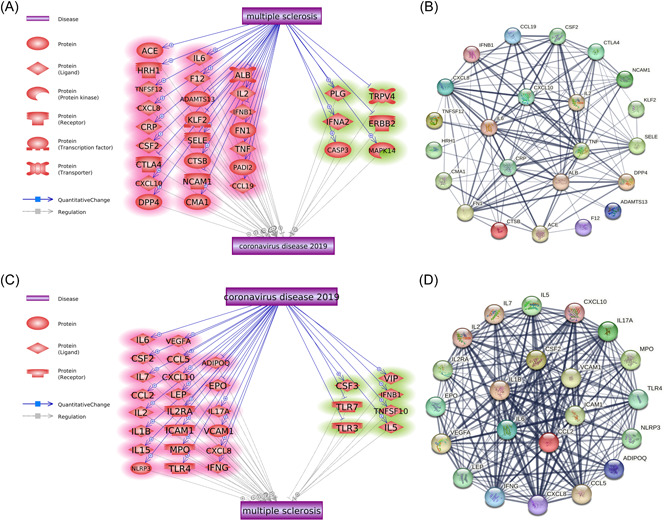
Figure 3.

Molecular pathways connecting MS and COVID‐19. (A) Molecular pathways from MS to COVID‐19. Promoting effects are highlighted in red, and inhibitory effects are highlighted in green. Quantitative genetic changes driven by MS exert more promoting than inhibitory effects on COVID‐19. (B) Protein−protein interactions among the 24 COVID‐19‐promoting genes. Line sizes are proportional to the combined scores of the interactions. (C) Molecular pathways from COVID‐19 to MS. Quantitative genetic changes driven by COVID‐19 exert more promoting than inhibitory effects on MS. (D) Protein−protein interactions among the 22 MS‐promoting genes. Line sizes are proportional to the combined scores of the interactions. MS, multiple sclerosis.
